
by Alpha | Jul 25, 2018 | Market Update, RQLAB
Our history with IPOs
$TWLO
During 2017 I liked TWLO and I thought the wave iv could hold, based on the fundamentals behind it, $FB/WhatsApp related, so started buying the 50 area and well… eventually the price collapsed below the IPO price, but you will see, I considered $TWLO is a company where you want your kids to work at, so I decided to trade the 30 area, just to stop out for risk management purposes, —the I am too fearful to hold a position of this size here—.
At the moment of buying T$WLO I appealed to my ignorance and read into what $TWLO does… and by reading into that I asked myself what is an API? And then read $TWLO bought Kurento, and during 2017 TWLO bought Beepsend.
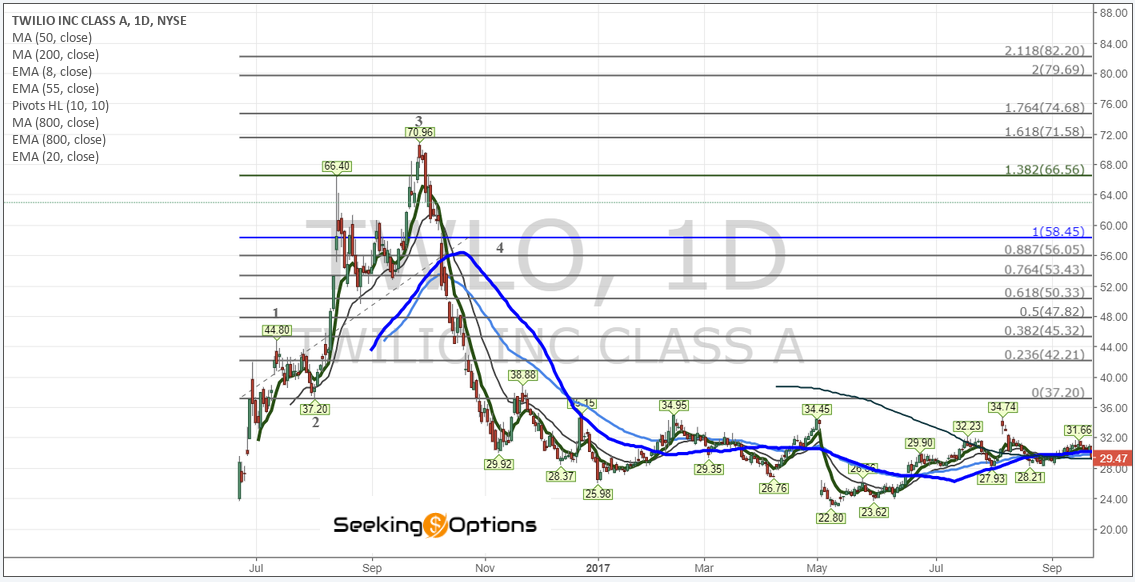
Kurento is a WebRTC media server and a set of client APIs making simple the development of advanced video applications for WWW and smartphone platforms. Kurento Media Server features include group communications, transcoding, recording, mixing, broadcasting and routing of audiovisual flows.
As a differential feature, Kurento Media Server also provides advanced media processing capabilities involving computer vision, video indexing, augmented reality and speech analysis. Kurento modular architecture makes simple the integration of third party media processing algorithms (i.e. speech recognition, sentiment analysis, face recognition, etc.), which can be transparently used by application developers as the rest of Kurento built-in features.
If you invested seconds of your time reading what’s Kurento, I hope you realized we ignore more and more of the internals of this world, in net terms when I came to $TWLO I felt ignorant. We sit behind our desks, monitoring prices while we trust the engineers of the companies we buy are creating new things we scarcely can imagine. This world is not ours anymore, this world belongs to those people out there that precisely created the interfaces we use to work together and we have never shaken our hands.
I really need we to understand that the greatest risk we face is not to have these companies, not precisely $TWLO, but those revolutionary names we usually hold in our portfolios. I think these companies are safe haven at least for next two years in terms of price and we should not allow sentiment to gain ground. With these companies we should not make emotional decisions.
$MSFT
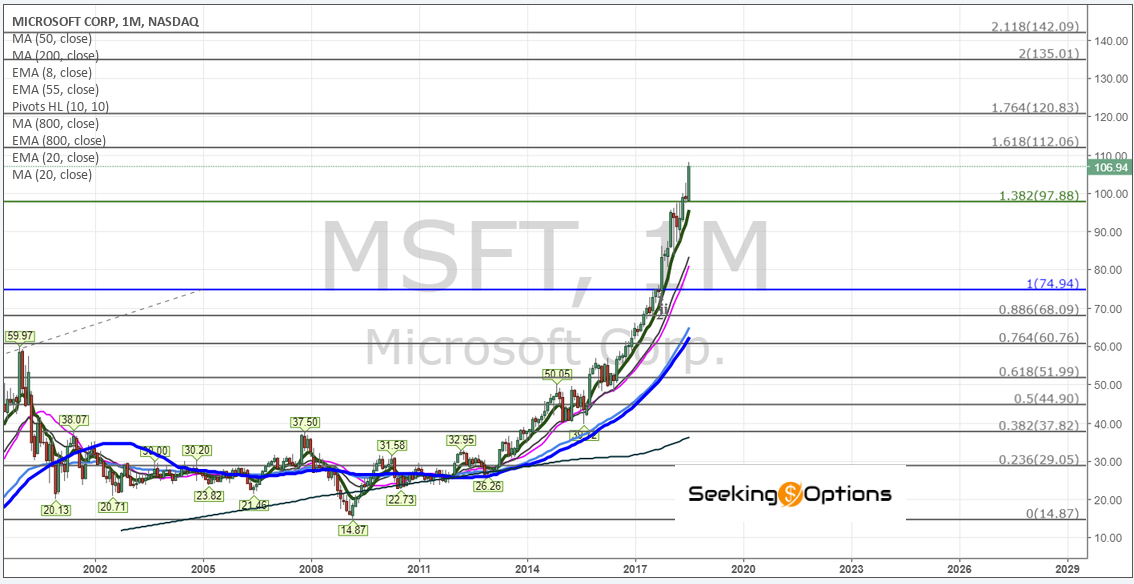
I have told you consistently that we measure the tape fairly well, we time the pullbacks with accuracy, current price $MSFT hit today was sent one year ago, on July 21st 2017, holding was all what we needed. So again, we have to keep in mind the very core of our business is investment in value.
Analysis:
$MSFT support should be 95 OPL the M-line versus long term targets at 120, the average between 200 and 50 DMA are at 95.82 so we are baking extreme levels within our support.
You look at me trading around $BABA, mainly because I ignore what’s happening in Asia —India, China— but I am sure $BABA has the scale and purchasing power to take advantage of any new thing that is being invented/created in the other side of the world.
Analysis:
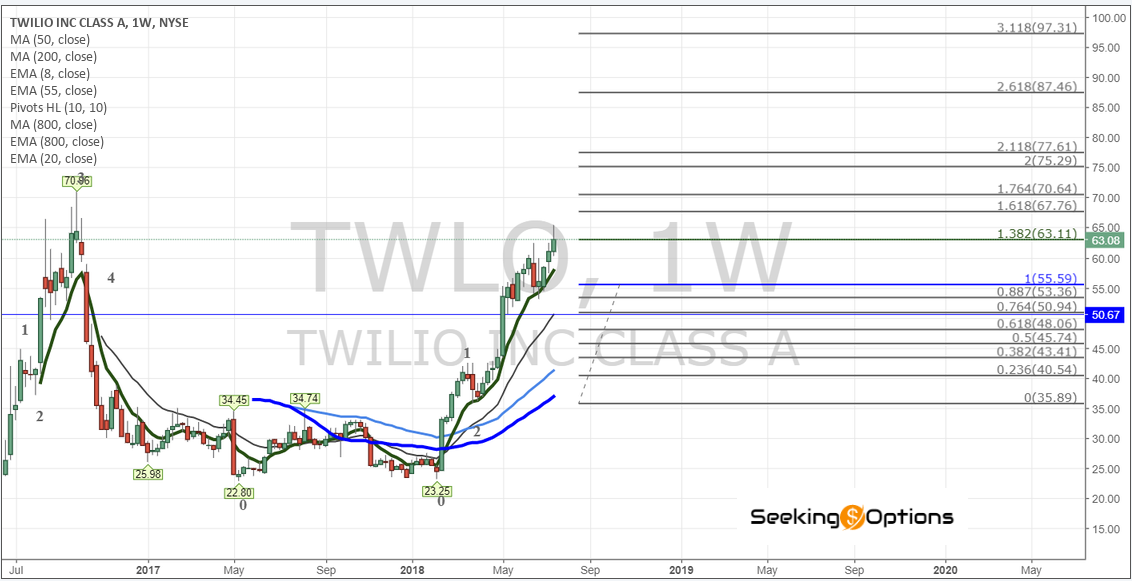
For $TWLO to be the company we think it is, should not break below 48.06 OPL Current 20 MA and EMA on Weekly are at 50 area. Operational extensions to the right.
$SHAK
If you want to pick a name where our patience was brutalized, that name is $SHAK. I don’t like MCD and I don’t think a very well informed generation likes MCD, but I like hamburgers and enjoy new tastes… and again management at $SHAK is the management we need/needed, focused on product and quality.
Analysis:
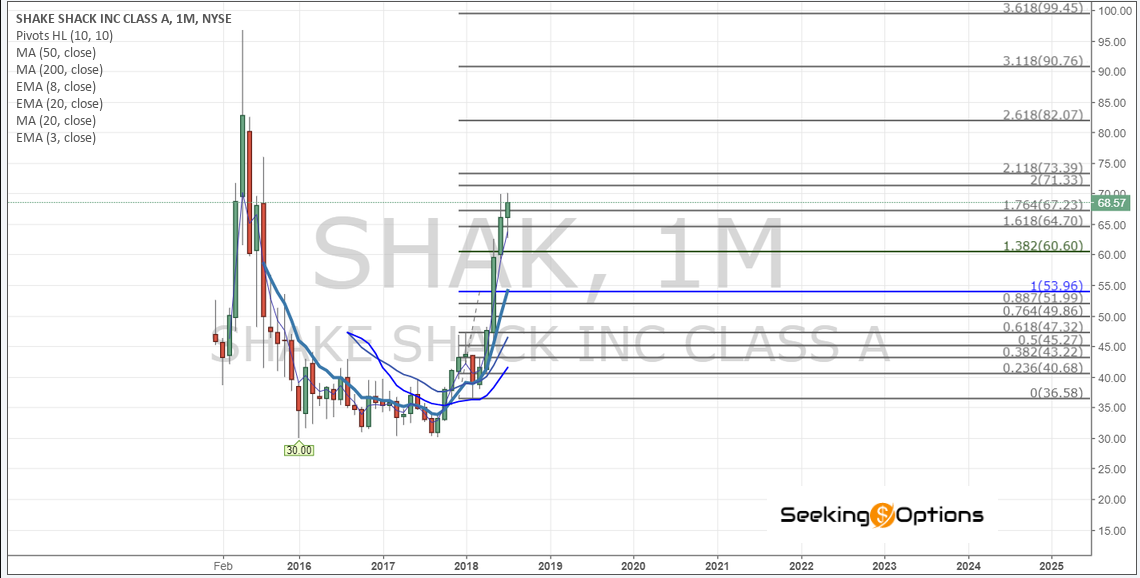
Analyzing $SHAK is not for anyone, trading it is, as we said, a challenge. A great great company, with 1% retrace and M-line at 53.96 . Should hold this line and get ready to challenge the all time high. Trading Shak is compared with leg days.
$ETSY
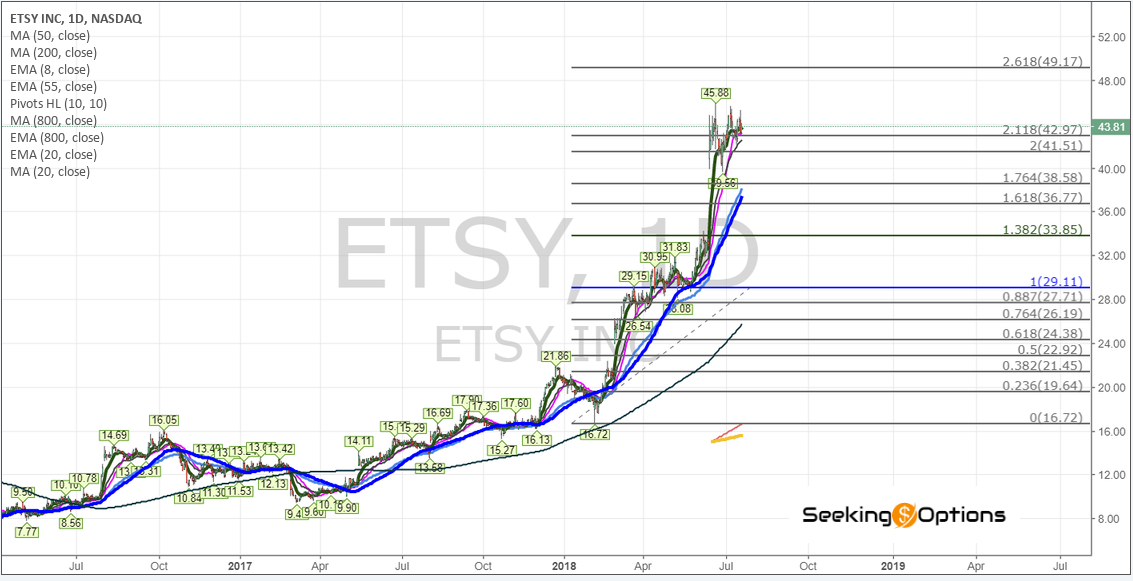
Something I missed because I did not see the real value at it’s moment, logic is simple: You want something handmade go to ETSY, you have something handmade and want to sell it, go to Etsy. Offer of products is as creative as you can imagine.
Analysis:
Needs to hold 29.11 but ideally should hold 33.85 OPL
$IQ
I have talked to you about ETSY/SHAK/TWLO… because apparently we ignore these are/were IPOs, these are companies that are offering solutions for markets, sectors are not the same for these three companies, and their road is what it is and what has been, what I made sure when entered trades into these names was that they were doing something in a way nobody had attempted in a solid way. In this sense I am sure NFLX can offer content for the Western Civilization, and I like the efforts $NFLX is doing with some good anime’s, which entices to people like me to have an account on NFLX, people bored of movies with only special effects or series that have nothing to offer after 5 episodes. And for me everything is boring, because, well, what more action or special effects do we need, we live at the brink of our seats every day: Trump, Korea, Washington, Russia, Rates, Earnings…
So in terms of Western Civilization, NFLX is good but I don’t think we can understand Chinese culture, they are a world apart, traditions, history… so we buy a company that, in my opinion, has Chinese beliefs built within them. Trading IPOs successfully is hard.
Analysis:
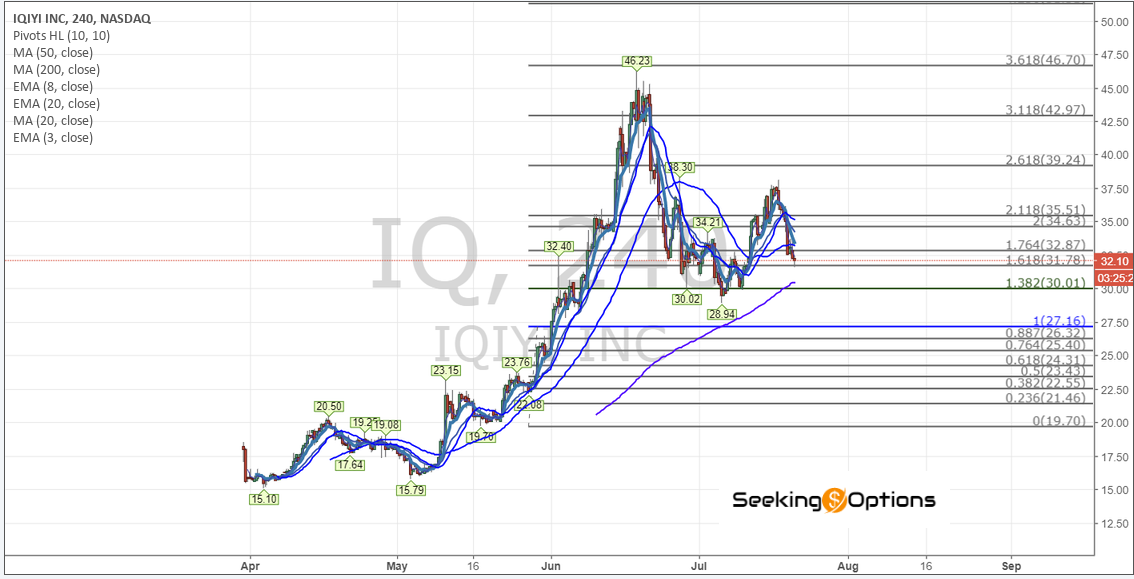
Support for $IQ OPL, could come at 27.16, but there is already a 1-2. We have learnt that once we establish a position we only can trade an IPO once a 1-2 is built and top of 1 is taken; in this case IQ should take 38.11 and not break below 28.94 on pullbacks, until then lower levels are likely.
I hope we learn from our experience to make money on nascent-consistent companies and not only for the purpose of making money. If we find good things we need to have the tenacity to trade wise, to be patient and to be consistent.
Anybody can buy one company at 100 and sell it for 50, so we should not be ashamed or bad about it, but TWLO from 23 to 62, SHAK from 28 to 70, ETSY from 9 to 43, we seriously, seriously must have learnt something.
I am sorry for not moving when everybody does and not feeling regret for going after what I seriously think is value and in this sense if we simply had continued trading our mature leaders are holding our just baby-borns-leaders we could have done much better.
Have a nice day.
Carlos
Seeking Options Team
Seeking Options Team – RQLAB Please email us if you want to be part of this group at [email protected]
Our last report from one of our portfolio (LINK)
Again we will give more detailed trade setups and targets, please check us our Chat Room..as low as 15 dollars.. check this link for options
Access to the Trade of the Week Click Here
SeekingOptions.com its partners and/or 3rd party affiliates are in open entry/closing positions in all of the above stocks, options, or other forms of equities. The trades provided in the above daily/weekly watchlist are simulations based on SeekingOptions oscillators strictly for educational purposes only, and not to solicit any stock , option or other form of equity. Under Section 202(a)(11)(A)-(E) of the Advisers Act this information is not considered investment or portfolio advisement from an authorized broker registered by the S.EC. (Securities Exchange Committee) and is limited to the scope of education in the form of market commentary through simulated trades via SeekingOptions.com indicators, and other educational tools.
U.S. Government Required Disclaimer – Commodity Futures Trading Commission Futures and Options trading has large potential rewards, but also large potential risk. You must be aware of the risks and be willing to accept them in order to invest in the futures and options markets. Don’t trade with money you can’t afford to lose. This is neither a solicitation nor an offer to Buy/Sell futures or options. No representation is being made that any account will or is likely to achieve profits or losses similar to those discussed on this web site. The past performance of any trading system or methodology is not necessarily indicative of future results.
CFTC RULE 4.41 – HYPOTHETICAL OR SIMULATED PERFORMANCE RESULTS HAVE CERTAIN LIMITATIONS. UNLIKE AN ACTUAL PERFORMANCE RECORD, SIMULATED RESULTS DO NOT REPRESENT ACTUAL TRADING. ALSO, SINCE THE TRADES HAVE NOT BEEN EXECUTED, THE RESULTS MAY HAVE UNDER-OR-OVER COMPENSATED FOR THE IMPACT, IF ANY, OF CERTAIN MARKET FACTORS, SUCH AS LACK OF LIQUIDITY. SIMULATED TRADING PROGRAMS IN GENERAL ARE ALSO SUBJECT TO THE FACT THAT THEY ARE DESIGNED WITH THE BENEFIT OF HINDSIGHT. NO REPRESENTATION IS BEING MADE THAT ANY ACCOUNT WILL OR IS LIKELY TO ACHIEVE PROFIT OR LOSSES SIMILAR TO THOSE SHOWN.
Use of any of this information is entirely at your own risk, for which SeekingOptions.com will not be liable. Neither we nor any third parties provide any warranty or guarantee as to the accuracy, timeliness, performance, completeness or suitability of the information and content found or offered in the material for any particular purpose. You acknowledge that such information and materials may contain inaccuracies or errors and we expressly exclude liability for any such inaccuracies or errors to the fullest extent permitted by law. All information exists for nothing other than entertainment and general educational purposes. We are not registered trading advisors. SeekingOptions.com is not a registered investment Advisor or Broker/Dealer. TRADE AT YOUR OWN RISK

by Alpha | Jul 20, 2018 | Market Update, RQLAB
Indexes
Expiration: July 18th, the next three expiration constructed by Joel, are positive.
Moores’ 2C-P: Current Value at 69.0 versus 67.4 previous.
FNG-Cycles: Showing a high for today 18th /tomorrow 19th, that high certainly can extend until this Friday, July 20th due to the positive projection derived from expiration. Caution is extremely recommended on the long side.
We know how overbought stochastics are… so a fast and sudden pullback should not come as a surprise, but as a buying opportunity.
EW analysis:
TNA
While $TNA does not exceed 92.76 an ABC pullback on Atl1M
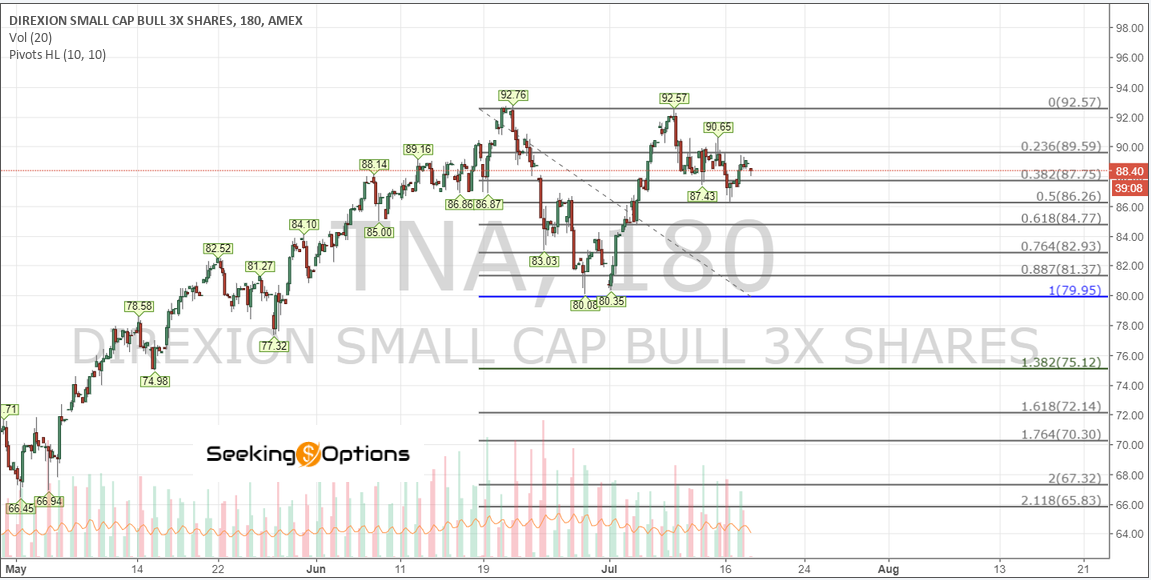
has minimum target at 79.95 with bearish target at 70.30. $TNA been lagging as we expected. Planing two entries, I think a spike to 75.12 is buyable, understanding that another entry at 70.30 has at least 70% probabilities to occur.
$TNA should not see such deep pullback
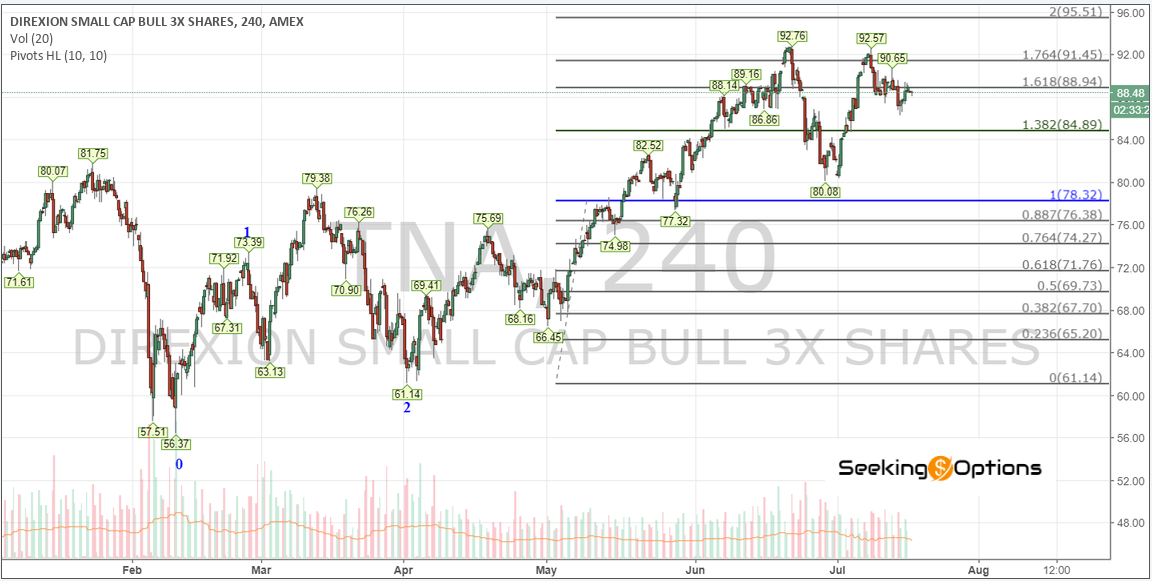
really should hold 79.95, but extended too much versus its peers $SPX/$QQQ, so probably needs a hard reset, that in no way should invalidate targets to 99/101 area, we have avoided $TNA and we will do well by avoiding it while it does not take 92.76.
$NDX, macro extensions
Line to worry on NDX is at 8067.3, the 4.764 extension OPL
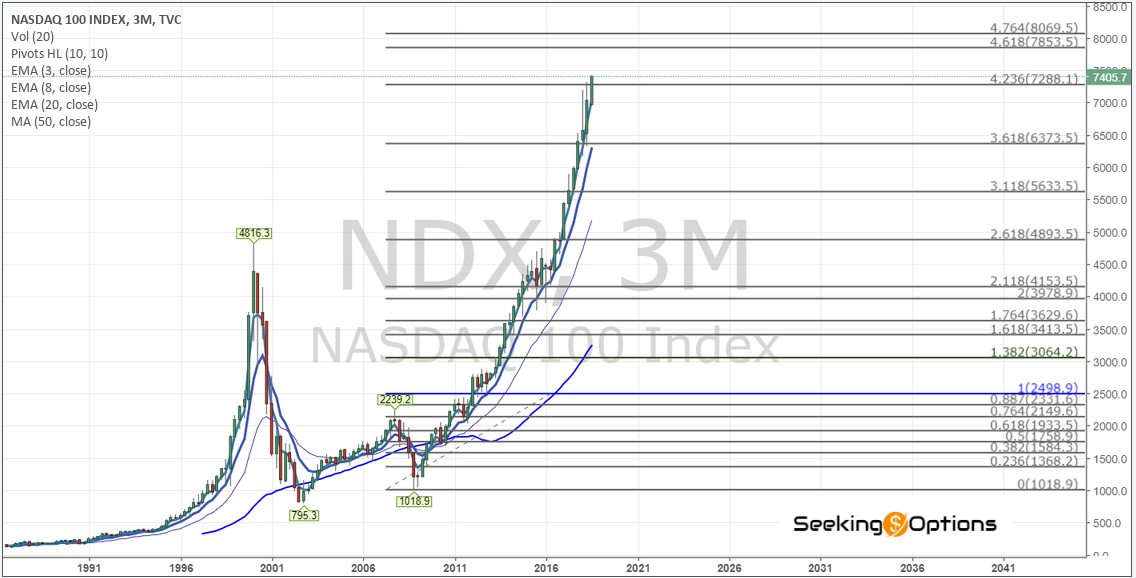
, immediate macro supports to consider are at 7341/7286.1, and we don’t see major risks while this area holds. Operative Extensions considering year 2016 pullback .
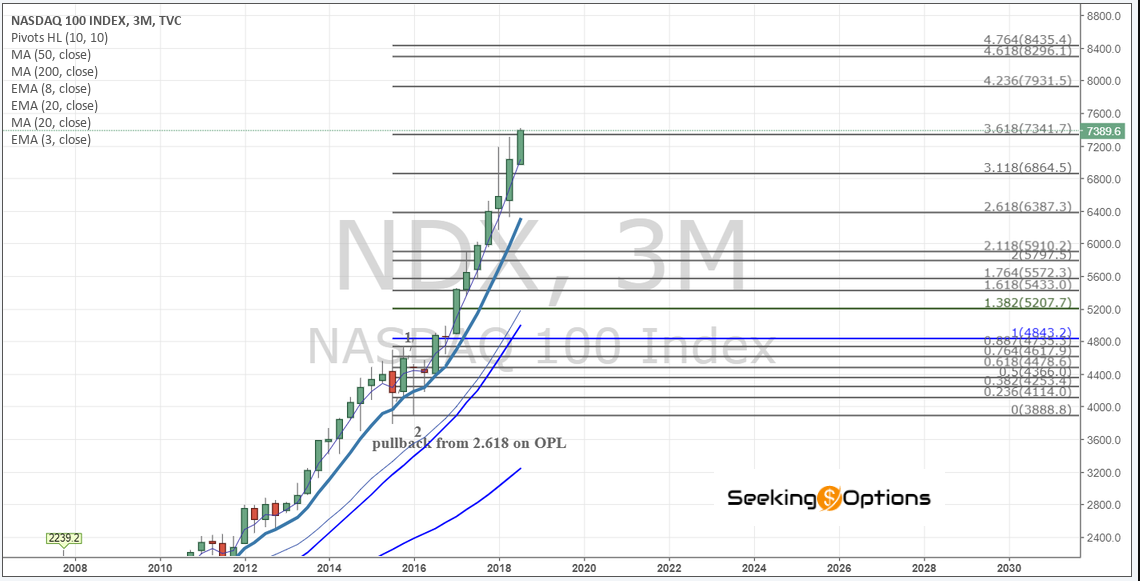
Micro for $NDX
Applying same approach on $NDX support is 7165.1 on Alt1M
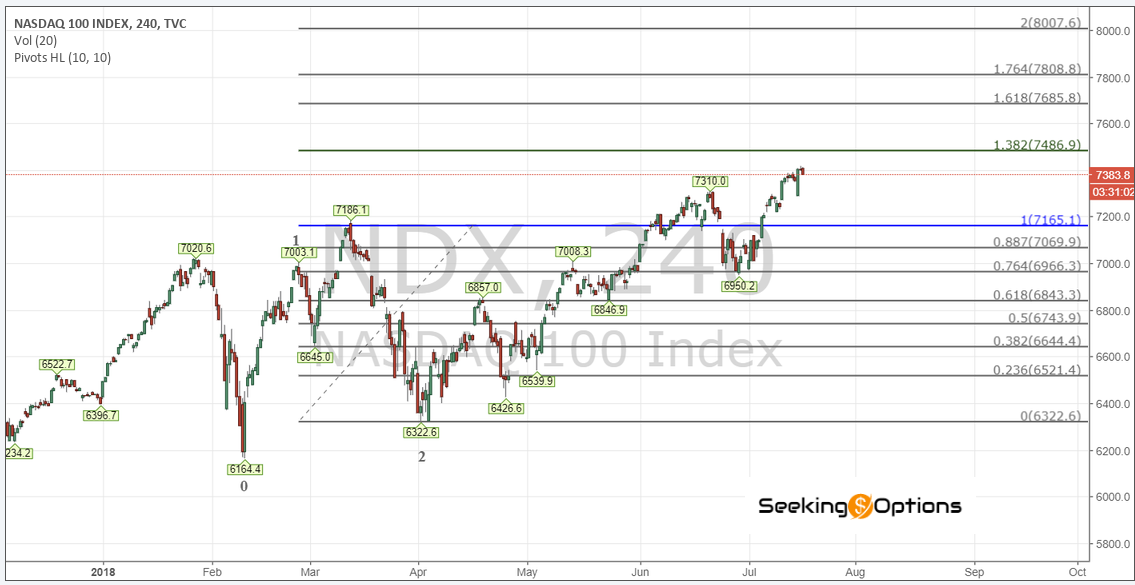
this is the count we have for all indexes, where the b wave was higher than the top of 1. While wordy, is necessary to say that if 1 up off the 6950 lows, support is 7184/7129 Alt3M
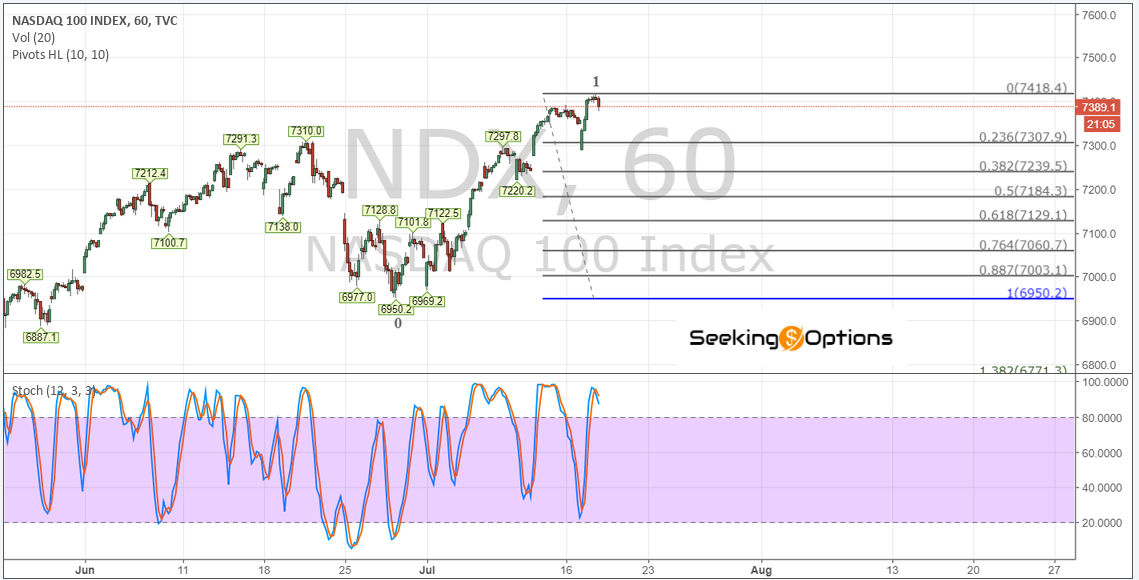
and that only adds strength to the standardized approach we using on all indexes, not much difference 7165 versus 7184/7129.
Equivalent important support for our trading vehicle $TQQQ is 60.40 Alt1M support is so precise that they overlap.
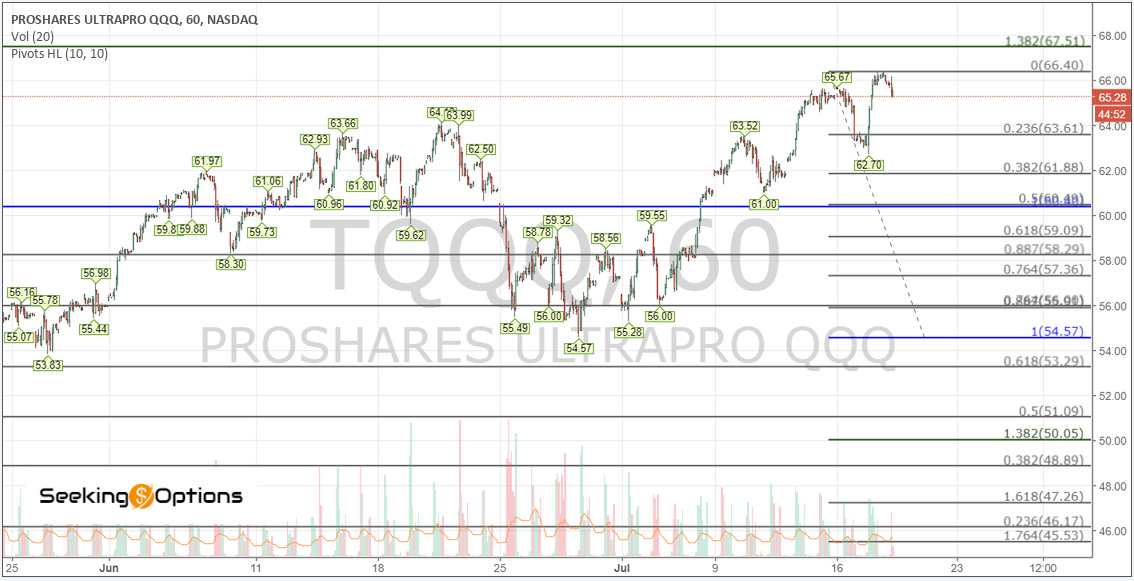
Important is to say that is necessary that $NDX breaks 6950 for we to press our accounts consistently once/if $NDX hits 6870, equivalent level of importance is 54.09 on $TQQQ Alt2M
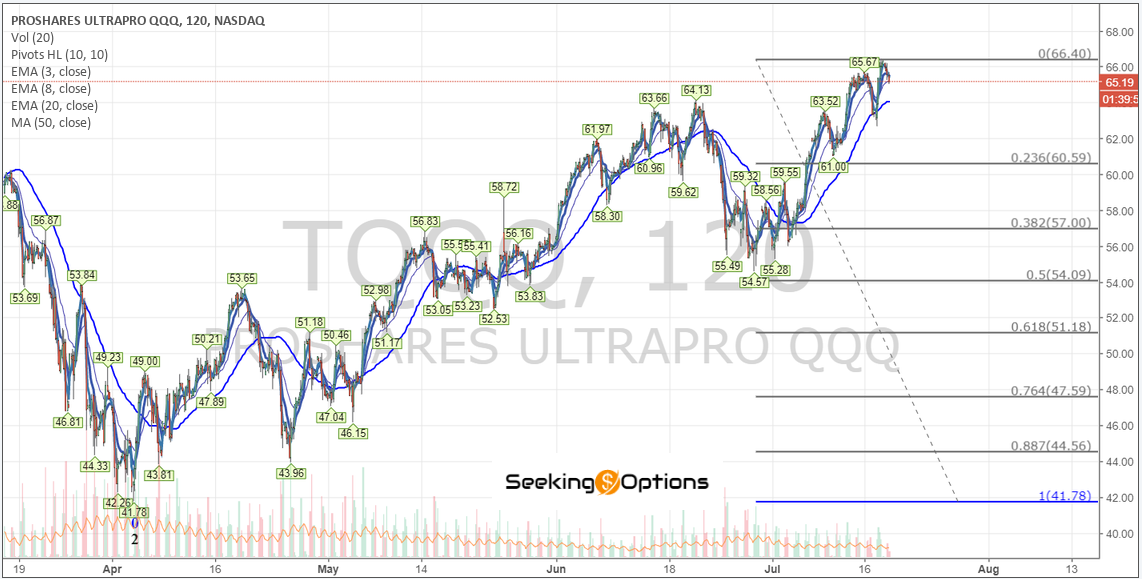
, but I personally will re-buy any retest of 55 area, and will start repurchasing at 60.4.
So being more clear, support for NDX is 7165, equivalent to 60.40 on $TQQQ. First entry can be planned for this level. Breaking below 6950 we should buy 6870 on $NDX, equivalent to 55 on $TQQQ.
$SPX
Last but not less important, SPX Alt1M Shown in diagram:
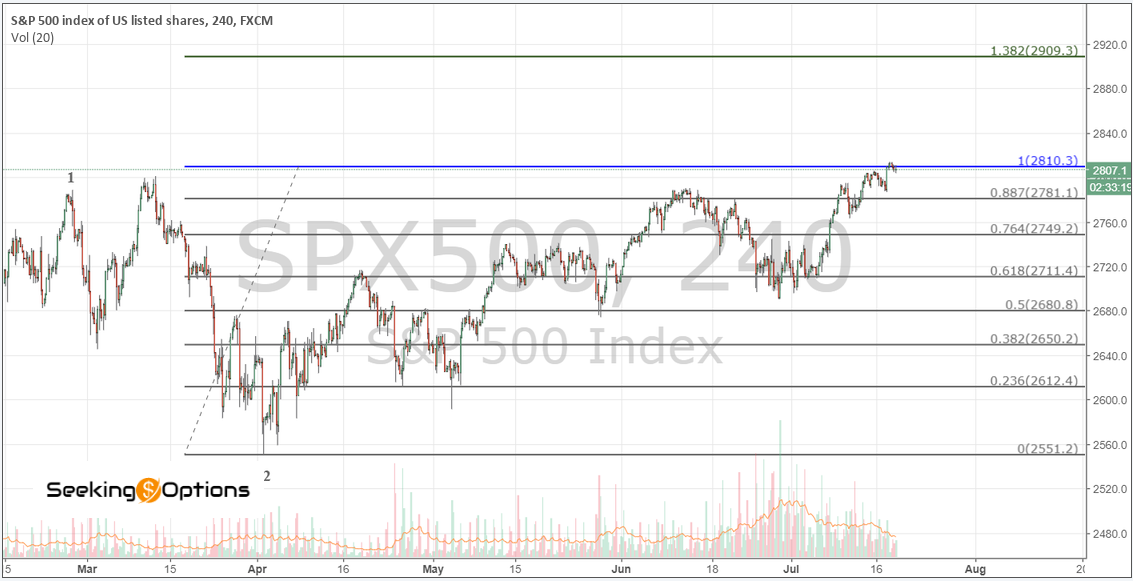
, support at 2711, this support really needs to eat well and prepare to hold the avalanche, because if it fails things can get out of control. 200 Daily Moving average at 2685.27
Joel’s Bigalow Weekly: Weekly MA at 2716.56
Joel’s Bigalow Monthly: M-line at 2696.72, the 20 MA is at 2544.05
Baking Average of supports: 2664 for SPX and we get the standard 5% pullback we have seen through the years.
we have sent you supports for GOOGL/AMZN/AAPL/FB/NVDA/NFLX
Have to say that if our supports hold, this could be one of the best years for indexes.
Have a nice day.
Good luck
P.S These Updates were sent to our internal members if you like to receive updates right away please contact [email protected])
Our last report from one of our portfolio (LINK)
Again we will give more detailed trade setups and targets, please check us our Chat Room..as low as 15 dollars.. check this link for options
Access to the Trade of the Week Click Here
Seeking Options Team – RQLAB Please email us if you want to be part of this group at [email protected]
SeekingOptions.com its partners and/or 3rd party affiliates are in open entry/closing positions in all of the above stocks, options, or other forms of equities. The trades provided in the above daily/weekly watchlist are simulations based on SeekingOptions oscillators strictly for educational purposes only, and not to solicit any stock , option or other form of equity. Under Section 202(a)(11)(A)-(E) of the Advisers Act this information is not considered investment or portfolio advisement from an authorized broker registered by the S.EC. (Securities Exchange Committee) and is limited to the scope of education in the form of market commentary through simulated trades via SeekingOptions.com indicators, and other educational tools.
U.S. Government Required Disclaimer – Commodity Futures Trading Commission Futures and Options trading has large potential rewards, but also large potential risk. You must be aware of the risks and be willing to accept them in order to invest in the futures and options markets. Don’t trade with money you can’t afford to lose. This is neither a solicitation nor an offer to Buy/Sell futures or options. No representation is being made that any account will or is likely to achieve profits or losses similar to those discussed on this web site. The past performance of any trading system or methodology is not necessarily indicative of future results.
CFTC RULE 4.41 – HYPOTHETICAL OR SIMULATED PERFORMANCE RESULTS HAVE CERTAIN LIMITATIONS. UNLIKE AN ACTUAL PERFORMANCE RECORD, SIMULATED RESULTS DO NOT REPRESENT ACTUAL TRADING. ALSO, SINCE THE TRADES HAVE NOT BEEN EXECUTED, THE RESULTS MAY HAVE UNDER-OR-OVER COMPENSATED FOR THE IMPACT, IF ANY, OF CERTAIN MARKET FACTORS, SUCH AS LACK OF LIQUIDITY. SIMULATED TRADING PROGRAMS IN GENERAL ARE ALSO SUBJECT TO THE FACT THAT THEY ARE DESIGNED WITH THE BENEFIT OF HINDSIGHT. NO REPRESENTATION IS BEING MADE THAT ANY ACCOUNT WILL OR IS LIKELY TO ACHIEVE PROFIT OR LOSSES SIMILAR TO THOSE SHOWN.
Use of any of this information is entirely at your own risk, for which SeekingOptions.com will not be liable. Neither we nor any third parties provide any warranty or guarantee as to the accuracy, timeliness, performance, completeness or suitability of the information and content found or offered in the material for any particular purpose. You acknowledge that such information and materials may contain inaccuracies or errors and we expressly exclude liability for any such inaccuracies or errors to the fullest extent permitted by law. All information exists for nothing other than entertainment and general educational purposes. We are not registered trading advisors. SeekingOptions.com is not a registered investment Advisor or Broker/Dealer. TRADE AT YOUR OWN RISK
by Alpha | Jul 17, 2018 | Market Update, RQLAB
Expiration for the week continue being positive. We know how overbought indexes are and that has not changed. So won’t post additional comments about current overbought conditions.
$NFLX: Down 12%, will open 3.52% below the projected 1% at 359 shown on daily chart below – 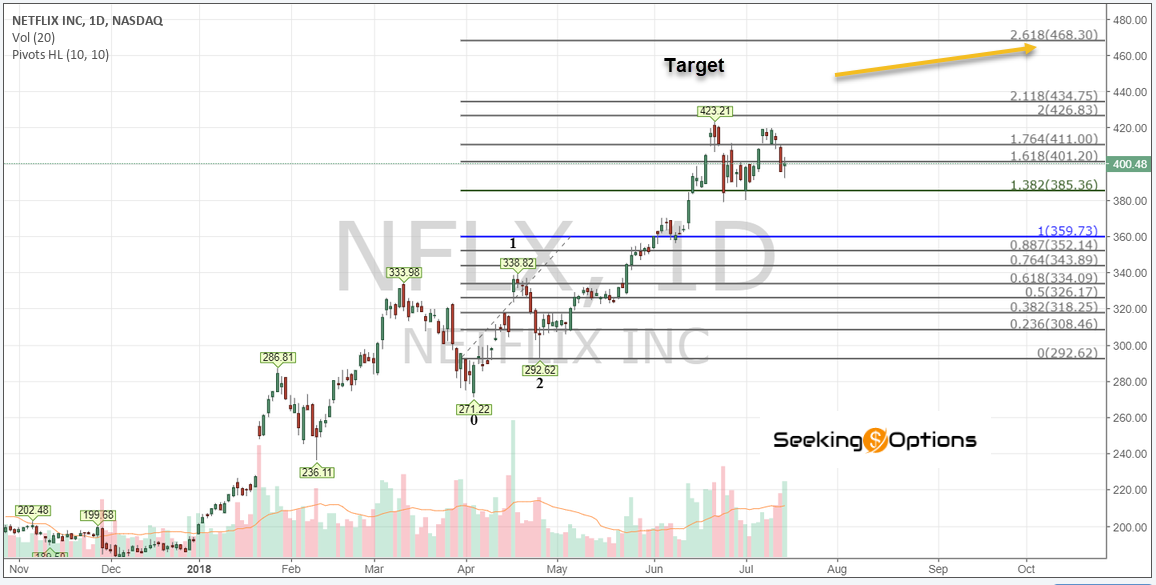 own
own
, will likely hit the 20 weekly moving average at 346
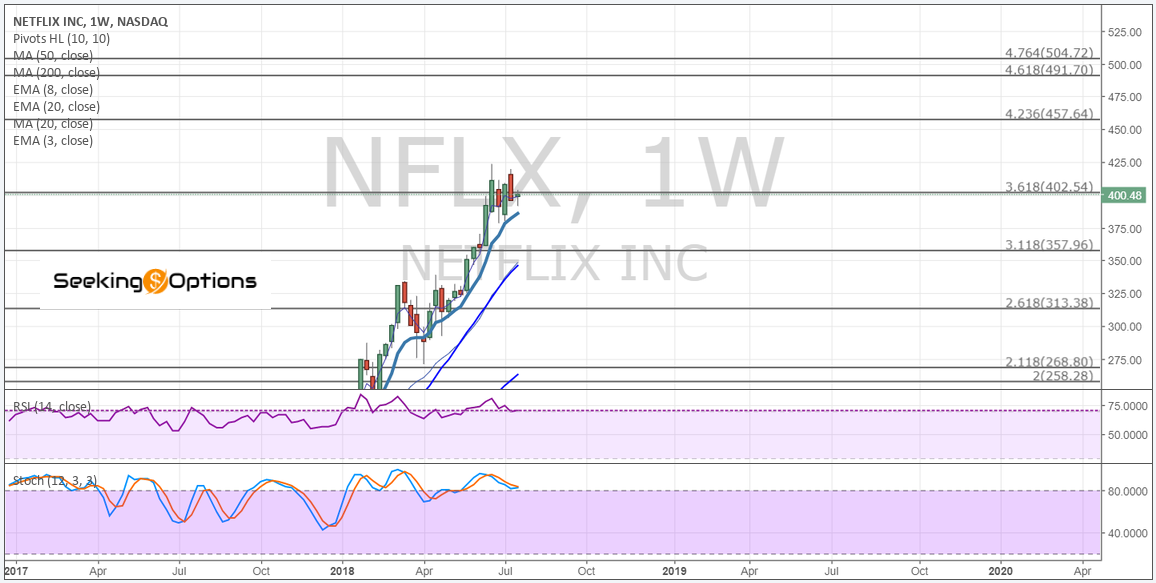
and again that’s a 3% deviation from standard fibonacci support at 357. We had observed it was too overbought on internals as to hold any gap up; the path of less resistance was in that regard, down, talking heads will be upgrading and downgrading today, we will observe reset of stochastics since the average of real risk in our macro counts is at 477. we have went long After hours yesterday and added to our positions..this was posted in our Chat Room
$FB: In macro terms conditions are not the same for $FB and NFLX, to have an idea for patterns to have some similarity, FB should be at 270 in order to present a significant risk. Stochastics is overbought on $FB
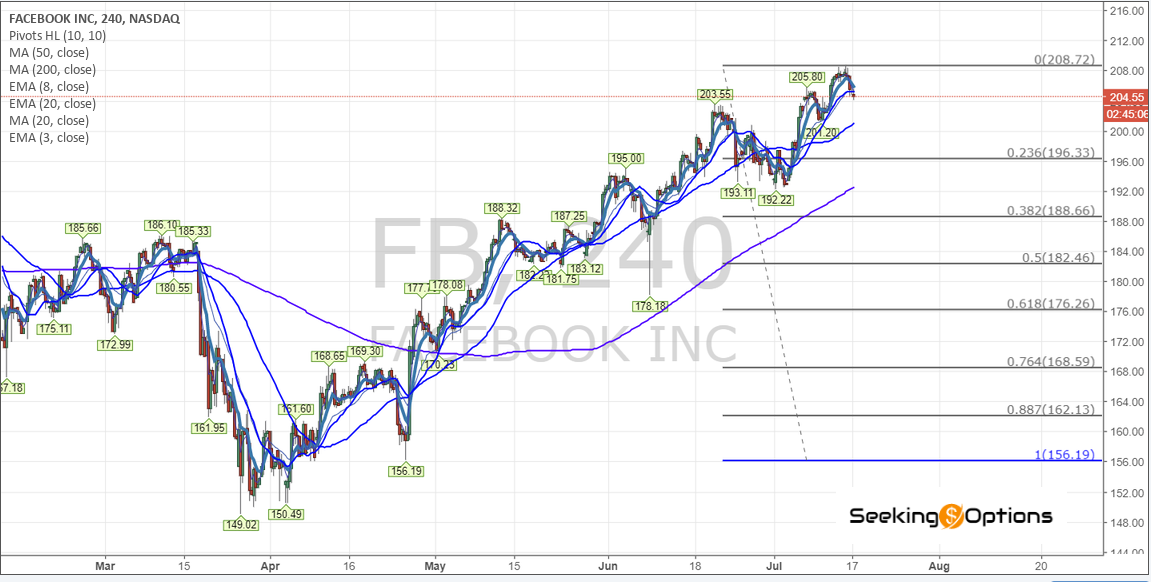
standard support should be at 182 and max at 171, if intended to hit 226 in three waves.
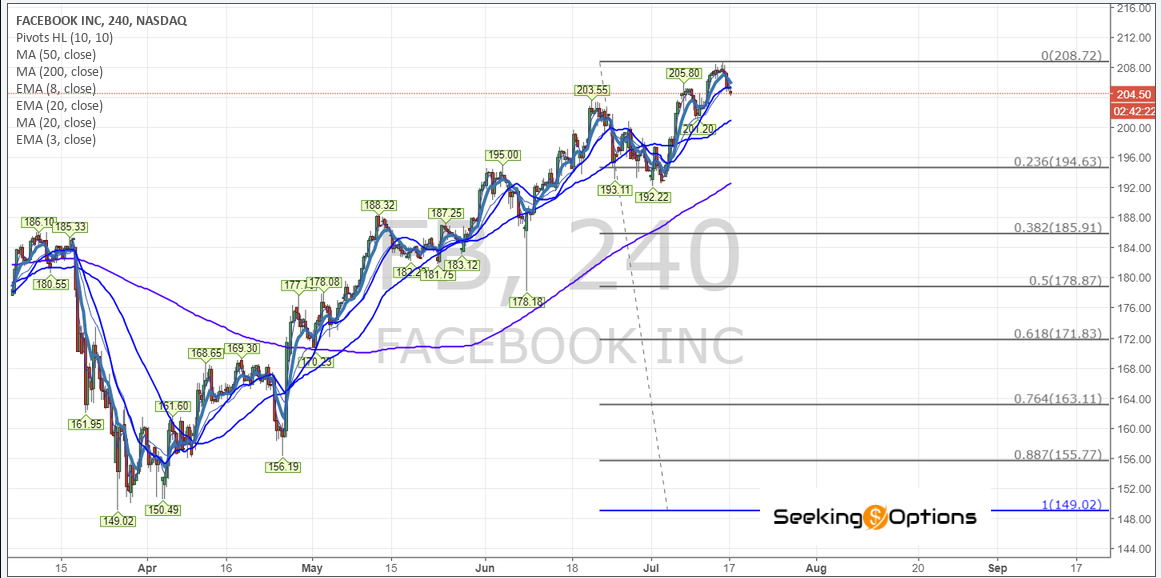
These updates that we send are very important, we take trades based on them and our portfolio is growing.. if you have questions feel free to talk to us.. [email protected] or join our room Chat Room
We sent $AMZN last Friday… will report $AAPL and $NVDA during the day.
Good luck
Our last report from one of our portfolio (LINK)
Again we will give more detailed trade setups and targets, please check us our Chat Room..as low as 15 dollars.. check this link for options
Access to the Trade of the Week Click Here
Seeking Options Team – RQLAB Please email us if you want to be part of this group at [email protected]
SeekingOptions.com its partners and/or 3rd party affiliates are in open entry/closing positions in all of the above stocks, options, or other forms of equities. The trades provided in the above daily/weekly watchlist are simulations based on SeekingOptions oscillators strictly for educational purposes only, and not to solicit any stock , option or other form of equity. Under Section 202(a)(11)(A)-(E) of the Advisers Act this information is not considered investment or portfolio advisement from an authorized broker registered by the S.EC. (Securities Exchange Committee) and is limited to the scope of education in the form of market commentary through simulated trades via SeekingOptions.com indicators, and other educational tools.
U.S. Government Required Disclaimer – Commodity Futures Trading Commission Futures and Options trading has large potential rewards, but also large potential risk. You must be aware of the risks and be willing to accept them in order to invest in the futures and options markets. Don’t trade with money you can’t afford to lose. This is neither a solicitation nor an offer to Buy/Sell futures or options. No representation is being made that any account will or is likely to achieve profits or losses similar to those discussed on this web site. The past performance of any trading system or methodology is not necessarily indicative of future results.
CFTC RULE 4.41 – HYPOTHETICAL OR SIMULATED PERFORMANCE RESULTS HAVE CERTAIN LIMITATIONS. UNLIKE AN ACTUAL PERFORMANCE RECORD, SIMULATED RESULTS DO NOT REPRESENT ACTUAL TRADING. ALSO, SINCE THE TRADES HAVE NOT BEEN EXECUTED, THE RESULTS MAY HAVE UNDER-OR-OVER COMPENSATED FOR THE IMPACT, IF ANY, OF CERTAIN MARKET FACTORS, SUCH AS LACK OF LIQUIDITY. SIMULATED TRADING PROGRAMS IN GENERAL ARE ALSO SUBJECT TO THE FACT THAT THEY ARE DESIGNED WITH THE BENEFIT OF HINDSIGHT. NO REPRESENTATION IS BEING MADE THAT ANY ACCOUNT WILL OR IS LIKELY TO ACHIEVE PROFIT OR LOSSES SIMILAR TO THOSE SHOWN.
Use of any of this information is entirely at your own risk, for which SeekingOptions.com will not be liable. Neither we nor any third parties provide any warranty or guarantee as to the accuracy, timeliness, performance, completeness or suitability of the information and content found or offered in the material for any particular purpose. You acknowledge that such information and materials may contain inaccuracies or errors and we expressly exclude liability for any such inaccuracies or errors to the fullest extent permitted by law. All information exists for nothing other than entertainment and general educational purposes. We are not registered trading advisors. SeekingOptions.com is not a registered investment Advisor or Broker/Dealer. TRADE AT YOUR OWN RISK

by Alpha | Jul 17, 2018 | Market Update, RQLAB
Long term chart on Amazon $AMZN (link) shows our secure target at 2106, long term charts are on Operational Layout.Next is AltC Layout (link).
In Summary we are planning two entries, one close to 1700 and one close to 1600. While on OPL link AMZN should hold 1668; a 7% deviation lead us to the M-line, currently at 1543.75 on Joel Withun’s MB chart, so by adding our second tranche on any spike toward 1620 we should be talking about a 3% additional deviation of “our planned second purchase”. And we plan to do two purchases on AMZN because our position there is necessary and we have tried hard to establish a solid position, but you know it is expensive.
Using the same AltC Layout, the 20 MA is at 1593 (link) and just below this level; the 2.618 extension of the subwave at 1554. So our levels, while imperfect are the best we can offer at the moment, the range to add should better defined this way; 1st range: 1720/1700 and the 2nd range: 1653/1600. Things get less complicated when we use the target at 2100 to measure R/R.
Internal Additional Information
Off the last 1346 lows on Alt4M (link) 1640 is 1% standard retrace. On Alt4M I used a grey ellipse, and micro charted that ellipse, and the 1% of this ellipse is 1725 (link) on Moon Phases.
The difference on alt Alt1M is that I used 34.68 as the bottom versus the 25.76 I used for OPL Layout…Hits on Alt1M are more accurate, and from macro extensions to macro extensions, the 3.618 support is at 1637; the baking of all this supports is at 1653, versus our target at 2100 area. All this is in on Alt1M (link).
Stay Tuned… Good luck
Our last report from one of our portfolio (LINK)
Again we will give more detailed trade setups and targets, please check us our Chat Room..as low as 15 dollars.. check this link for options
Access to the Trade of the Week Click Here
Seeking Options Team – RQLAB Please email us if you want to be part of this group at [email protected]
SeekingOptions.com its partners and/or 3rd party affiliates are in open entry/closing positions in all of the above stocks, options, or other forms of equities. The trades provided in the above daily/weekly watchlist are simulations based on SeekingOptions oscillators strictly for educational purposes only, and not to solicit any stock , option or other form of equity. Under Section 202(a)(11)(A)-(E) of the Advisers Act this information is not considered investment or portfolio advisement from an authorized broker registered by the S.EC. (Securities Exchange Committee) and is limited to the scope of education in the form of market commentary through simulated trades via SeekingOptions.com indicators, and other educational tools.
U.S. Government Required Disclaimer – Commodity Futures Trading Commission Futures and Options trading has large potential rewards, but also large potential risk. You must be aware of the risks and be willing to accept them in order to invest in the futures and options markets. Don’t trade with money you can’t afford to lose. This is neither a solicitation nor an offer to Buy/Sell futures or options. No representation is being made that any account will or is likely to achieve profits or losses similar to those discussed on this web site. The past performance of any trading system or methodology is not necessarily indicative of future results.
CFTC RULE 4.41 – HYPOTHETICAL OR SIMULATED PERFORMANCE RESULTS HAVE CERTAIN LIMITATIONS. UNLIKE AN ACTUAL PERFORMANCE RECORD, SIMULATED RESULTS DO NOT REPRESENT ACTUAL TRADING. ALSO, SINCE THE TRADES HAVE NOT BEEN EXECUTED, THE RESULTS MAY HAVE UNDER-OR-OVER COMPENSATED FOR THE IMPACT, IF ANY, OF CERTAIN MARKET FACTORS, SUCH AS LACK OF LIQUIDITY. SIMULATED TRADING PROGRAMS IN GENERAL ARE ALSO SUBJECT TO THE FACT THAT THEY ARE DESIGNED WITH THE BENEFIT OF HINDSIGHT. NO REPRESENTATION IS BEING MADE THAT ANY ACCOUNT WILL OR IS LIKELY TO ACHIEVE PROFIT OR LOSSES SIMILAR TO THOSE SHOWN.
Use of any of this information is entirely at your own risk, for which SeekingOptions.com will not be liable. Neither we nor any third parties provide any warranty or guarantee as to the accuracy, timeliness, performance, completeness or suitability of the information and content found or offered in the material for any particular purpose. You acknowledge that such information and materials may contain inaccuracies or errors and we expressly exclude liability for any such inaccuracies or errors to the fullest extent permitted by law. All information exists for nothing other than entertainment and general educational purposes. We are not registered trading advisors. SeekingOptions.com is not a registered investment Advisor or Broker/Dealer. TRADE AT YOUR OWN RISK

by Alpha | Jul 16, 2018 | Market Update, RQLAB
$SPX and $QQQ Updates:
Moores’ 2C-P is at 69.3
Weekly Expiration, constructed by Joel Withun, is looking positive for the week ending on July 20th . Experience has demonstrated that when we have serious overbought conditions combined with positive projections, the only sector that can move consistently higher is $NDX,where reality can triumph conjectures.
On Joel’s daily chart, 362 is at 2838 for $SPX and for $QQQ 362 is 182.39; stochastics continue being excessively high. Values are similar to 162 extensions on Weekly chart.
Weekly volatility inverted is very overbought. Volatility daily has hit the upper bollinger band in all the three instruments we follow.
Weekly stochastics favor $NVDA, $VT and $AXP; $BIDU looks better than $BABA using weekly stochastic.
EW analysis
The $QQQ ETF has now support at 173.77 (Chart shown)
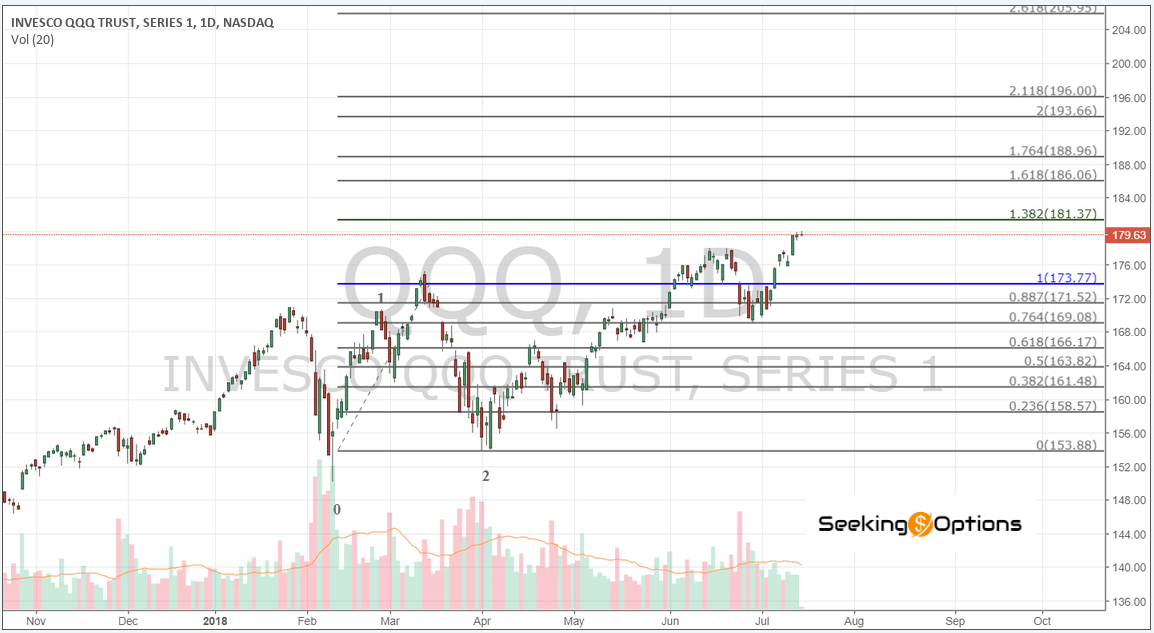
and many of our $QQQ holdings hit support during last correction, companies like $BABA, $HTHT, $IQ, $BIDU, $NVDA, $TWTR, $AAPL, corrected to their respective support areas, In this regard, I think that if you are planning to go long in overbought conditions we have to suggest $QQQ as the instrument of your consideration.
If you are thinking $AMZN has more room to go before our ideal entries, you should do well by considering stops just below 1810/1790.
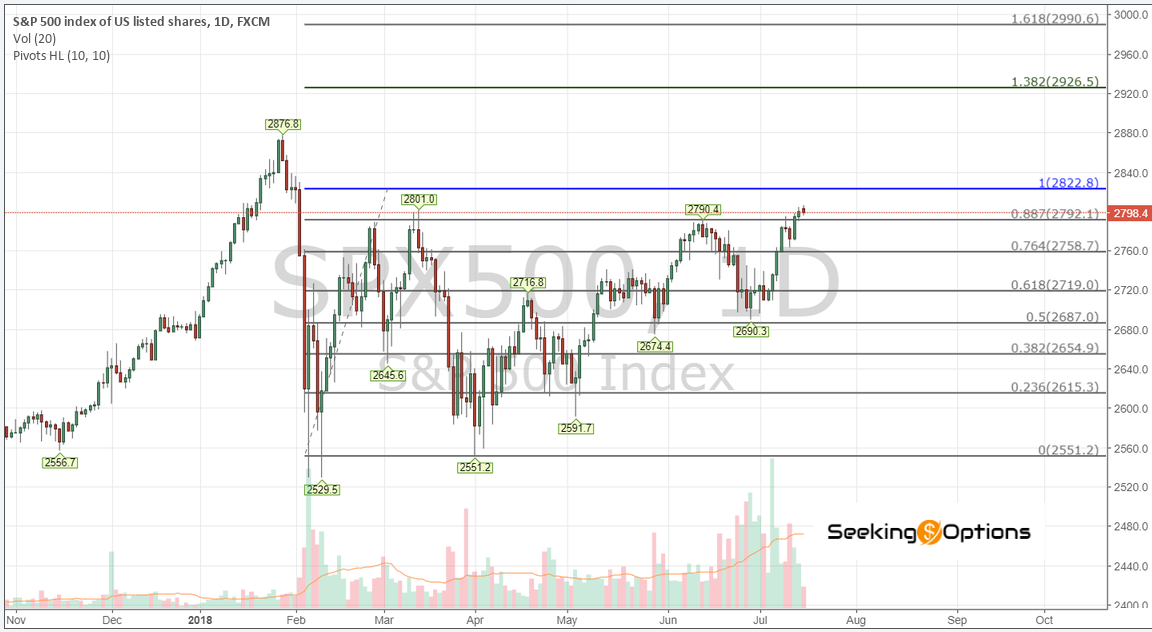
When you compare $SPX chart
to $QQQ
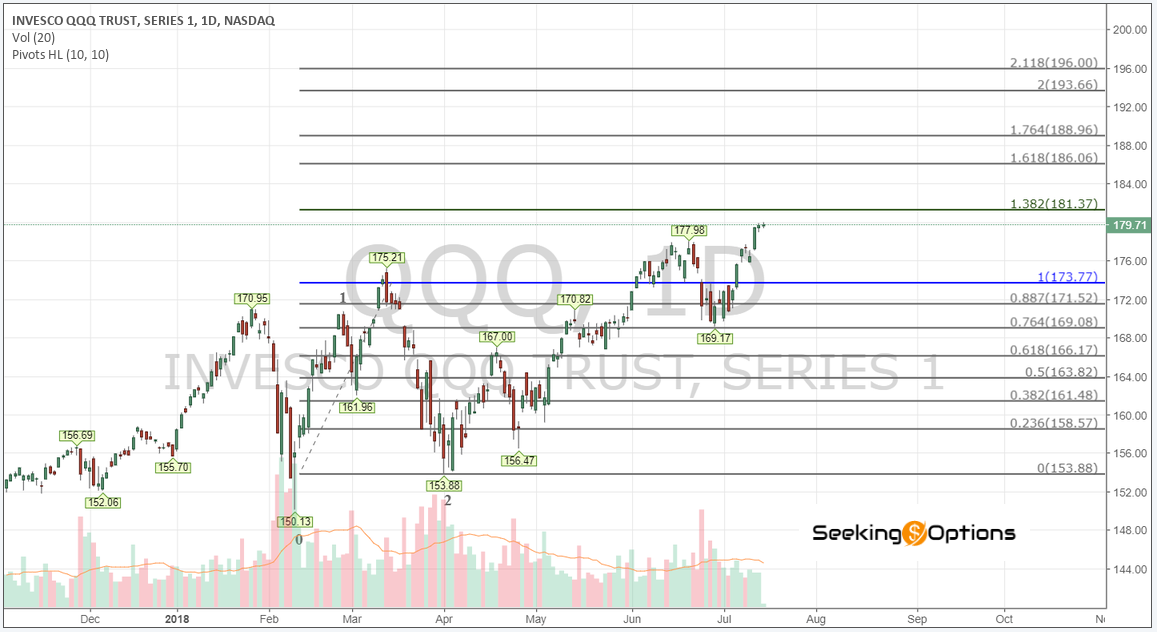
you can see why we are suggesting $QQQ longs; the 3rd wave already was ignited on $QQQ and while we could see a pullback, this should be shallower than on $SPX which still needs work to confirm a breakout above the range.
Trade Well and Good luck
Our last report from one of our portfolio (LINK)
Again we will give more detailed trade setups and targets, please check us our Chat Room..as low as 15 dollars.. check this link for options
Access to the Trade of the Week Click Here
Seeking Options Team – RQLAB Please email us if you want to be part of this group at [email protected]
SeekingOptions.com its partners and/or 3rd party affiliates are in open entry/closing positions in all of the above stocks, options, or other forms of equities. The trades provided in the above daily/weekly watchlist are simulations based on SeekingOptions oscillators strictly for educational purposes only, and not to solicit any stock , option or other form of equity. Under Section 202(a)(11)(A)-(E) of the Advisers Act this information is not considered investment or portfolio advisement from an authorized broker registered by the S.EC. (Securities Exchange Committee) and is limited to the scope of education in the form of market commentary through simulated trades via SeekingOptions.com indicators, and other educational tools.
U.S. Government Required Disclaimer – Commodity Futures Trading Commission Futures and Options trading has large potential rewards, but also large potential risk. You must be aware of the risks and be willing to accept them in order to invest in the futures and options markets. Don’t trade with money you can’t afford to lose. This is neither a solicitation nor an offer to Buy/Sell futures or options. No representation is being made that any account will or is likely to achieve profits or losses similar to those discussed on this web site. The past performance of any trading system or methodology is not necessarily indicative of future results.
CFTC RULE 4.41 – HYPOTHETICAL OR SIMULATED PERFORMANCE RESULTS HAVE CERTAIN LIMITATIONS. UNLIKE AN ACTUAL PERFORMANCE RECORD, SIMULATED RESULTS DO NOT REPRESENT ACTUAL TRADING. ALSO, SINCE THE TRADES HAVE NOT BEEN EXECUTED, THE RESULTS MAY HAVE UNDER-OR-OVER COMPENSATED FOR THE IMPACT, IF ANY, OF CERTAIN MARKET FACTORS, SUCH AS LACK OF LIQUIDITY. SIMULATED TRADING PROGRAMS IN GENERAL ARE ALSO SUBJECT TO THE FACT THAT THEY ARE DESIGNED WITH THE BENEFIT OF HINDSIGHT. NO REPRESENTATION IS BEING MADE THAT ANY ACCOUNT WILL OR IS LIKELY TO ACHIEVE PROFIT OR LOSSES SIMILAR TO THOSE SHOWN.
Use of any of this information is entirely at your own risk, for which SeekingOptions.com will not be liable. Neither we nor any third parties provide any warranty or guarantee as to the accuracy, timeliness, performance, completeness or suitability of the information and content found or offered in the material for any particular purpose. You acknowledge that such information and materials may contain inaccuracies or errors and we expressly exclude liability for any such inaccuracies or errors to the fullest extent permitted by law. All information exists for nothing other than entertainment and general educational purposes. We are not registered trading advisors. SeekingOptions.com is not a registered investment Advisor or Broker/Dealer. TRADE AT YOUR OWN RISK

by Alpha | Jul 13, 2018 | Market Update, RQLAB
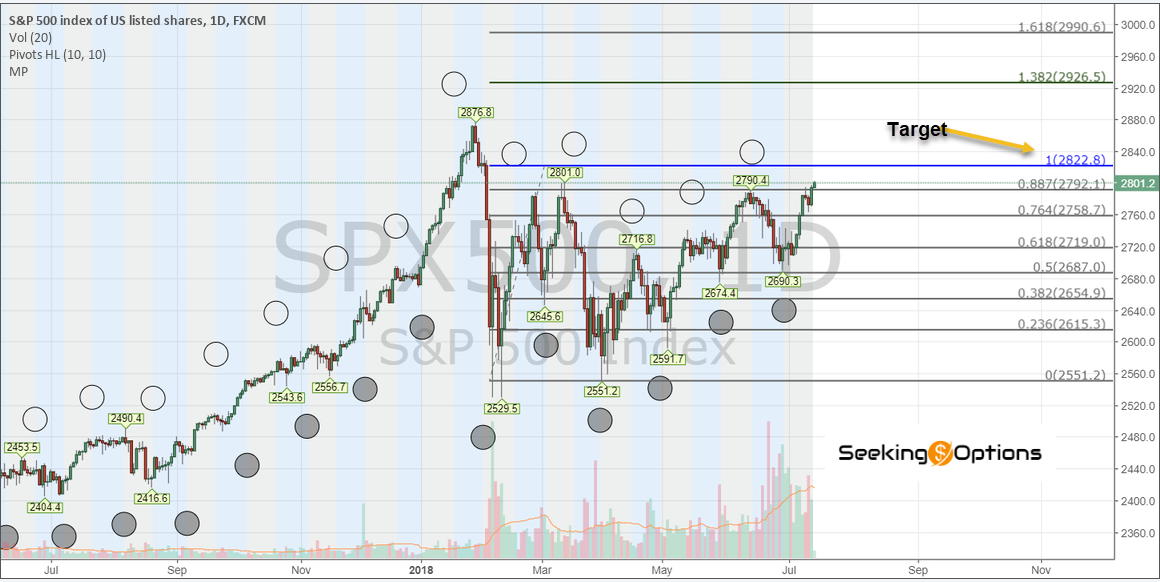
$SPX, daily Bigalow: July 12th, $SPX daily bigalow, 8 EMA at 2768 and 50 MA at 2734.12. 50 DMA, Very consistent with .618 retrace
Daily stochastics are overbought in all the indexes.
On $SPX McClellan chart; advance/decline ratio and McClellan oscillator are at the highs. Summation is not easy for interpretation, but looks life five up off the recent lows. For NDX McClellan Chart, oscillator and advance/decline ratio has started to reset, indicating that prices are not extending organically anymore, without organic growth trading the long side is not a winning strategy, but a losing game.
Daily Volatility: VIX Inverted says we could see that hit to 2822.8, but VXV/VIX and VIX/VXST, are not allowing more upside. Joel Has 162 extension at 2810 for tomorrow on $SPX and for $QQQ 162 is at 181.34.
OI: we do remind you that we had a “high” projected for this Friday, July 13th, based on weekly razz constructed by Joel Withun, additionally, the expiration for tomorrow has a positive projection. After this week, we have lower projections at least until July 27th, based on current OI.
Only $TSLA, $YY, $HTHT and partially $BABA have low stochastics. All our other holdings are very high in stochastics terms, not very good longs to chase. We need a reset on $NFLX before earnings.
We still think we have higher levels to see on $QQQ, probably for 195 as secure target, but not from right here. We should see a pullback to 171 before that occurs.
Trade Well and Good luck
Our last report from one of our portfolio (LINK)
Again we will give more detailed trade setups and targets, please check us our Chat Room..as low as 15 dollars.. check this link for options
Access to the Trade of the Week Click Here
Seeking Options Team – RQLAB Please email us if you want to be part of this group at [email protected]
SeekingOptions.com its partners and/or 3rd party affiliates are in open entry/closing positions in all of the above stocks, options, or other forms of equities. The trades provided in the above daily/weekly watchlist are simulations based on SeekingOptions oscillators strictly for educational purposes only, and not to solicit any stock , option or other form of equity. Under Section 202(a)(11)(A)-(E) of the Advisers Act this information is not considered investment or portfolio advisement from an authorized broker registered by the S.EC. (Securities Exchange Committee) and is limited to the scope of education in the form of market commentary through simulated trades via SeekingOptions.com indicators, and other educational tools.
U.S. Government Required Disclaimer – Commodity Futures Trading Commission Futures and Options trading has large potential rewards, but also large potential risk. You must be aware of the risks and be willing to accept them in order to invest in the futures and options markets. Don’t trade with money you can’t afford to lose. This is neither a solicitation nor an offer to Buy/Sell futures or options. No representation is being made that any account will or is likely to achieve profits or losses similar to those discussed on this web site. The past performance of any trading system or methodology is not necessarily indicative of future results.
CFTC RULE 4.41 – HYPOTHETICAL OR SIMULATED PERFORMANCE RESULTS HAVE CERTAIN LIMITATIONS. UNLIKE AN ACTUAL PERFORMANCE RECORD, SIMULATED RESULTS DO NOT REPRESENT ACTUAL TRADING. ALSO, SINCE THE TRADES HAVE NOT BEEN EXECUTED, THE RESULTS MAY HAVE UNDER-OR-OVER COMPENSATED FOR THE IMPACT, IF ANY, OF CERTAIN MARKET FACTORS, SUCH AS LACK OF LIQUIDITY. SIMULATED TRADING PROGRAMS IN GENERAL ARE ALSO SUBJECT TO THE FACT THAT THEY ARE DESIGNED WITH THE BENEFIT OF HINDSIGHT. NO REPRESENTATION IS BEING MADE THAT ANY ACCOUNT WILL OR IS LIKELY TO ACHIEVE PROFIT OR LOSSES SIMILAR TO THOSE SHOWN.
Use of any of this information is entirely at your own risk, for which SeekingOptions.com will not be liable. Neither we nor any third parties provide any warranty or guarantee as to the accuracy, timeliness, performance, completeness or suitability of the information and content found or offered in the material for any particular purpose. You acknowledge that such information and materials may contain inaccuracies or errors and we expressly exclude liability for any such inaccuracies or errors to the fullest extent permitted by law. All information exists for nothing other than entertainment and general educational purposes. We are not registered trading advisors. SeekingOptions.com is not a registered investment Advisor or Broker/Dealer. TRADE AT YOUR OWN RISK
Page 4 of 15« First«...23456...10...»Last »


 own
own


