by Carlos Narváez | Dec 6, 2016 | Market Update, RQLAB
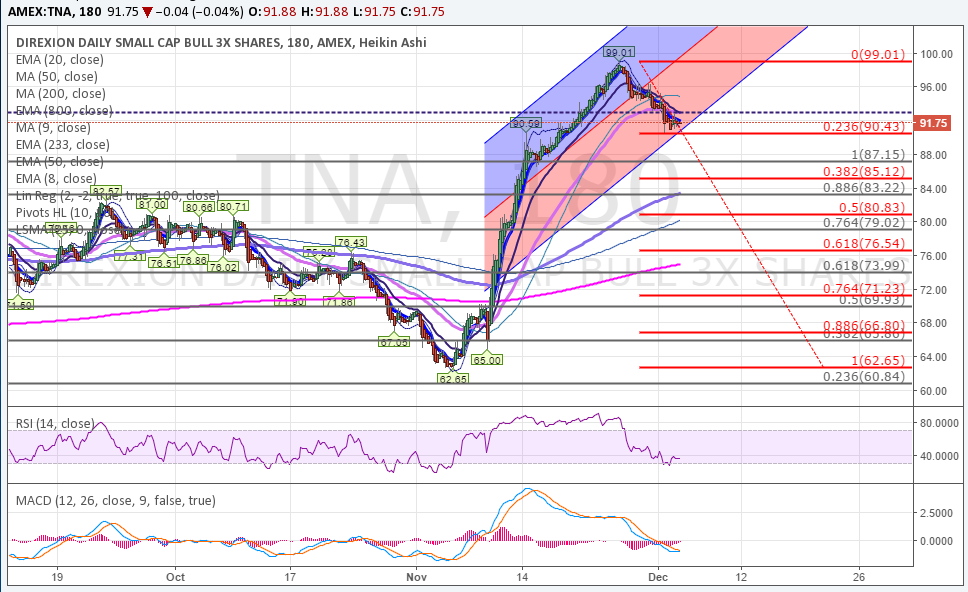
After hours high for $TNA was 97.33, on this clean chart here (link) and (link), you can observe the hit at the 4.236 extension that we have been tracking from the lows, and here want to extend, because for some time we have been very cautious with this market; we have considered that the 4.764 extension located at 101.42 is strong enough to stop this move and provide a decent pullback, but considering the microstructure, the blue 1 up, (link) and for as long as the market holds ─ideally but not necessarily─, above 93.95 is probable that the market breaks out above our resistance level with ideal target for this leg up at the 104.91-105.89 range.
Initial indication for a major extension to 104.91 and 105.89 is a move to 100.81 that only retests the supports at 97.76 and then breakout above 101.42, once the market does that, it is very reasonable that 104.91-105.89 is on track.
We were very cautious with the 91.76 support level for shorts; here there is no reason to be bullish or bearish but to allow the price to prove itself. Best entry for conservative traders would be on a pullback to 93.96, since we are are still concerned about 101.42; rarely that extension is taken, but time and parameters will indicate if we are wrong and the market will surprise to the upside and we must be prepared.
A break under 90.56, last low, would invalidate these scenarios and we would maintain our solid buying areas detailed previously.
$FCX:
Supports for FCX are at 15.52 and 15.37, it is a stock in which we have no opinion, but setup is too good to ignore, so we are long.

by Carlos Narváez | Dec 5, 2016 | Market Update, RQLAB
The most relevant information from the price is that 91.76 held on $TNA as seen here (link). Should the price advance above 96.50 we can consider bottom is in. Contrary case immediate target for the market is 88.46. Since we expect action to be after hours, potential exists that any gap down satisfies our 88.46 target on $TNA through $TF.
The shape of the short term and long term razzmatazz waves continue being bearish. PCR (Put to Call Ratio) is at 2.916, that provides a neutral to bearish approximation for the market too. 2C-P readings are not low enough to signal a rally can start or can be sustained.
We maintain a solid buying range for from 86.45 to 84.82. This does not exclude 77 from our eyes, since as reported on November 7th this move still can be a diagonal 77 is equivalent to .618 from the last low, chart here:

Picture continue being mixed. Reason we sold our position bought at 91.99 while we wait for more information from the price.

by Carlos Narváez | Dec 1, 2016 | Market Update, RQLAB
Previous update November 29th
Over the weekend we updated our approximation for the market to neutral and de-risked our accounts, but yesterday we traded $TNA on the long side, simply because possibility exists for our call to be wrong.
Yesterday our base case got some foundation from the sentiment. As we reported, by the close $TNA developed what clearly can be counted as five waves down, chart here (
link) standard fibonacci retraces for wave 2 up are 96.75 and 97.28, but ought to excursiveness of bullish sentiment from traders, we can move that target to 98.49. Excepting TNA moves above 99.01 we maintain that a 3rd wave down is to develop.
For major support areas please refer to weekend update, retraces for wave 4, here (
link), previous 1% and .886 at retrace here in gray, (
link). Average of 135 minute Good for Entry at 87.65. Attached. Our solid buying range goes from 86.45 to 84.82.
Current update
Monthly retraces for $TNA are as following: .886 retrace 91.76, chart here (
link) previous 1% at 87.15 as seen here (
link), the alt micro count projects a bottom to 92.03 equivalent to 2.118 extension, standard is 1.764 at 92.78 as seen here (
link), but given current action 2.118 seems more likely. Additionally 1% extension in the gray count -that represents our base count- chart here (
link) is at 91.95, that’s too close to .886 support at 91.76, and even the market can stretch to 88.46 (
link) being short under 91.76 might be extremely dangerous since we are looking for the bottom of wave iv of 3 of 5 not the end of Western civilization.
We have a solid buying range from 86.45 to 84.82 as discussed on November 29th, but on #RQLab we will accumulate $TNA at 91.95 and 88.46, since conservative target is at 102.

by Carlos Narváez | Nov 28, 2016 | RQLAB, Trade Ideas
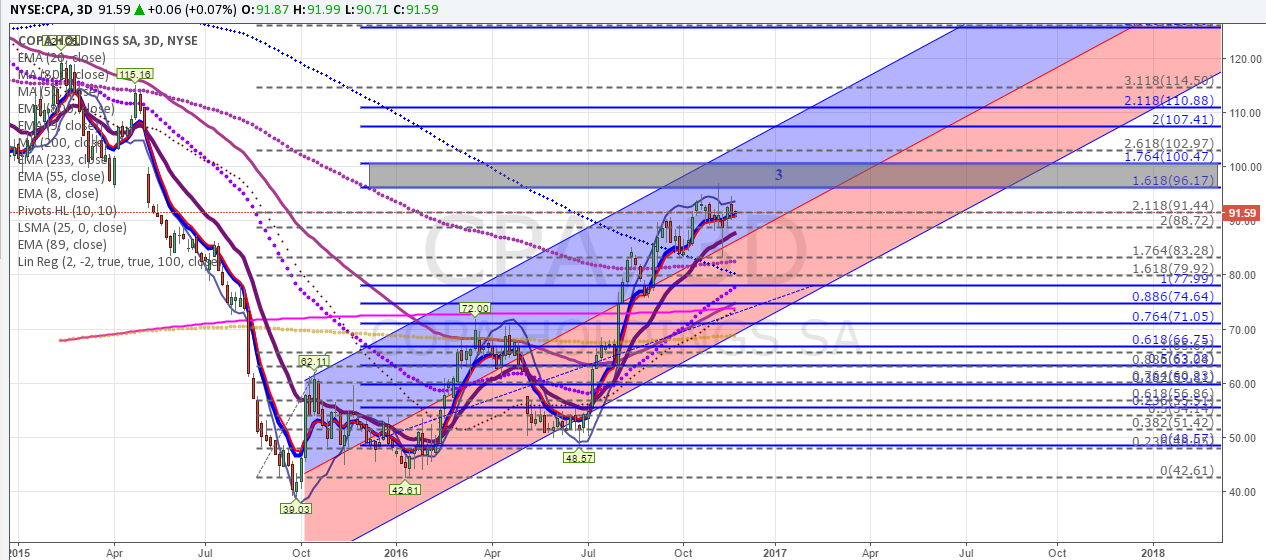
Targets for the 3rd waves up on $CPA must be placed at 2.618 extensions, that’s what experience tells.
We Were trying to find out why we successfully downgraded our targets for CPA to 95-98 when the ideal target was 102.77 . Revising October 17th charts, this was due probably to the monthly pivot at 94 with 2.618 extension previously at 102.78 —now refined— to 102.97, so this gave us an average for 98.4 and we simply were more conservative and we sold 95.
The blue fibonaccis are practically the same that we sent on our update on September 20th, as shown in the following Chart:

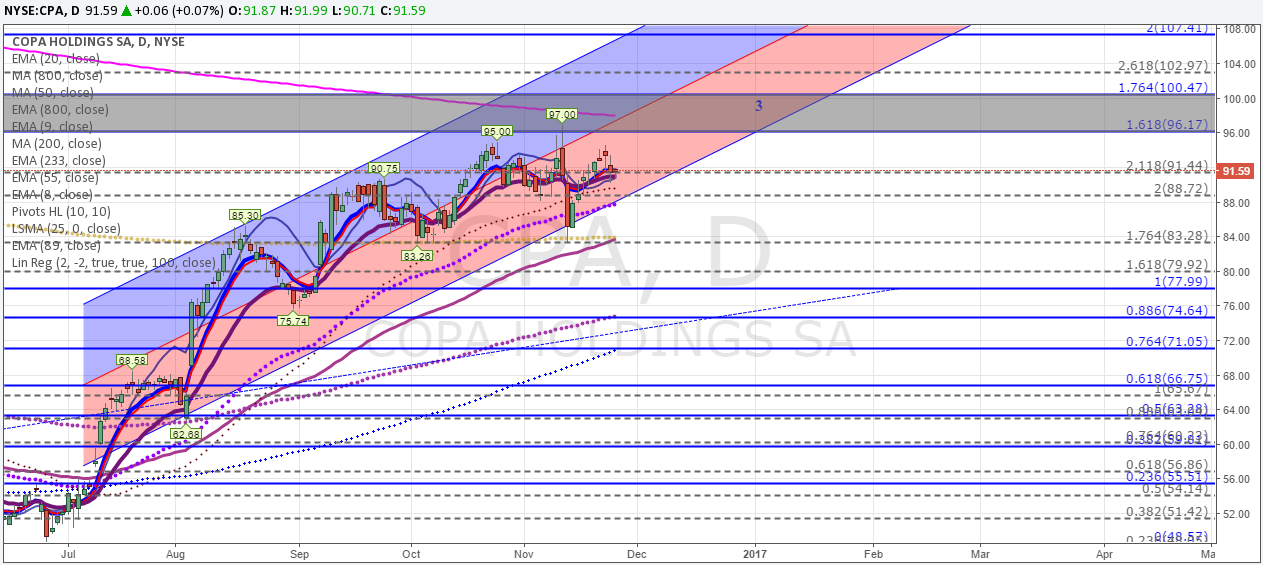
We can see the hit to the 1.618 extension, and by taking a closer look on the daily chart we see that after that hit we got a pullback, chart here

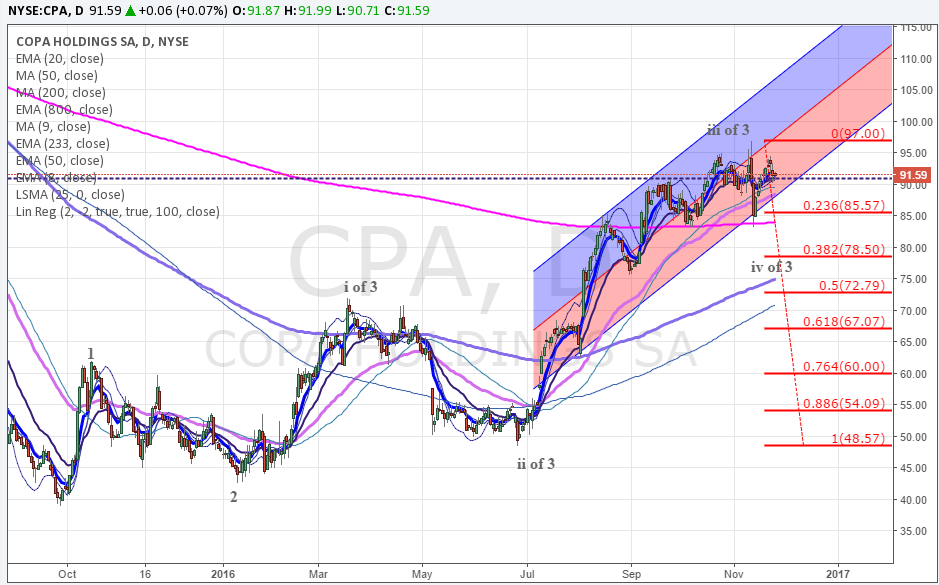
that went to .236 retrace as seen here

since on this same chart you can see previous waves 2 and ii were really deep, we should not expect a deep wave iv, so even though we want the 78.50 area we might not get it and this would be confirmed once CPA moves above 100.47 with follow through above 102.22 and 102.97 then we will establish reasonable probable targets for CPA at 124 with daily average resistance at 118.97 that can be lowered to 114.12 based on the monthly.
We like the 78.50 area, because on the 1440 minutes chart, we have a buying area around the 76.79-75.74 range that matches the weekly buying zone. Additionally there is a monthly pivot at 75. Under 76.79 support is 65-62, but that’s very unlikely based on current setup.
Average Weeklies supports system is 75.71 and monthly 68.39, for max support at 72. Daily 50MA is at 89.54 should be first support, then weekly 20MA at 81.49, then the 8EMA on the monthly at 76.14, then daily 200MA at 70.60 and weekly 50MA at 66.09.
Daily Dtschoastic is toppy but weekly is oversold enough, so we would be fortunate if we get the 78-75 area. Above 102.97 I have serious doubts we can see a pullback before 114.
Good Luck..
– Carlos
This is not an advise nor a a buy or sell recommendation


