
by Alpha | Mar 17, 2018 | IKE, Trade Ideas, Trading
SPX Credit Spread Trade
We know its already march but we promised to post our final results for 2017 $SPX Credit spread, a trade that we dearly love to take in our Group, lead by our super IKE.
If you are someone who is busy and not able to trade all the time, this trade can help you add income to your portfolio, you place the order and set it as a good to close order in place. We did have to adjust 2 times last year but that was no issue, just like any other trade.
2017 year was another solid year for Seeking Options team, and the $SPX Trade alone have had 28 winning trades from total 30 that’s 93% win Rate, we had 8 adjustments and 2 losses. Total Net results were 86% Profit, So if you risk 2K per trade (initial Investment) you would have netted by year end 1,717$ USD almost DOUBLE!.
Congratulation on your investments and trades!!
And thanks for being part of Seeking Options Team!!
If you wish to participate in the SPX Credit spread trade, you can click on this link
Did you know that Trading 1 Contract in the past two months would have netted a $760 in Profits i.e it covers the cost for one year and more of the VIP Membership – Which includes access to all services (includes SPX Credit Spreads.)

by Alpha | Feb 15, 2017 | IKE, Market Update
Most if not all of our stocks pick targets have been making new highs and we have been booking profits as we go higher. At these market levels it would not surprise us to see retail try to short it to only lead us higher as dip buyers have been rewarded for their bullish positions from stock buying or selling premium via put credit spreads, (if any can be found).
There is so much money sitting on the sideline waiting to buy a stock market breakout, hence a break out from current level can be very strong and would means another 25 handles in $SPX, which can take us up to 2367 area..thus far we will will continue look for buying opportunities on any pullback.
Here is the 60 minutes chart on ES

Open Interest for EOW3 expiration on Fri 2/17/17.
For Monday 13th these were, PCR: 2.724 (UP from 2.525) Change PCR executed at 10.385
For Tuesday 14th these were, PCR: 2.792 (UP from 2.724) Change PCR executed at 5.724
For Wednesday 15th, these are PCR: 2.893 (UP from 2.792) Change PCR executed at 4.732

by Carlos Narváez | Jan 30, 2017 | IKE, Market Update, RQLAB
Previous update, January 27th:
While we could take time to chest thump our current trades and join to the crow cheerleading current market action or regret our failure for not adding $TNA on time we will address a more serious situation: Market is about to hit 1% of the gray 1-2 on this chart (link), so, as we considered on January 9th, we will update support for the market to 2187, this means stops should be trailed and cores should be reduced to protect profits. Initial signals for concern should come once market breaks under 2291 followed by a break under 2274.
Looking at today’s update:
The short term razzmatazz wave is showing a low int tomorrow Tuesday, January 31st. Then a rebound into February 2nd – 4th. At the same time PCR expiring tomorrow is into standard territory at 2.077; meaning the call for lows into January 30th and 3st is valid.
After this rebound on indexes that is projected for February 2nd-4th, both, and this is important, short term and long term razzmatazz wave are pointing lower into mid’s of February, so based on open interest we can’t make a bullish case for the market. We must adjust our expectations and assume a retrace will be seen for as long as $SPX is under 2311 $SPX. We would not trade a breakout above 2311 based on current internals, might be short lived.
Moores’ 2C-P is at 96.08, adding confidence to our call for lower lows.
Japhy the trader from Data Trader pro: $VIX is under 11, for the first time since august 2015. VIX put/call is back to extreme lows. These are the types of areas that CAN (not will, can!) start violent reversals. i am looking to start small vol longs soon, next 1-2 days max, but not in $VXX or its leveraged brethren
Cyclical Analysis matches interestingly well the Open Interest projections. Charts will be provided per required in our Chat Room
We maintain our expectation for lower levels on indexes, price is not diverging from our call, so we will consider we are right until price proves something different.
The Following Charts were Posted in our Chat Room which we constantly provide updated view on market conditions along with trade setups
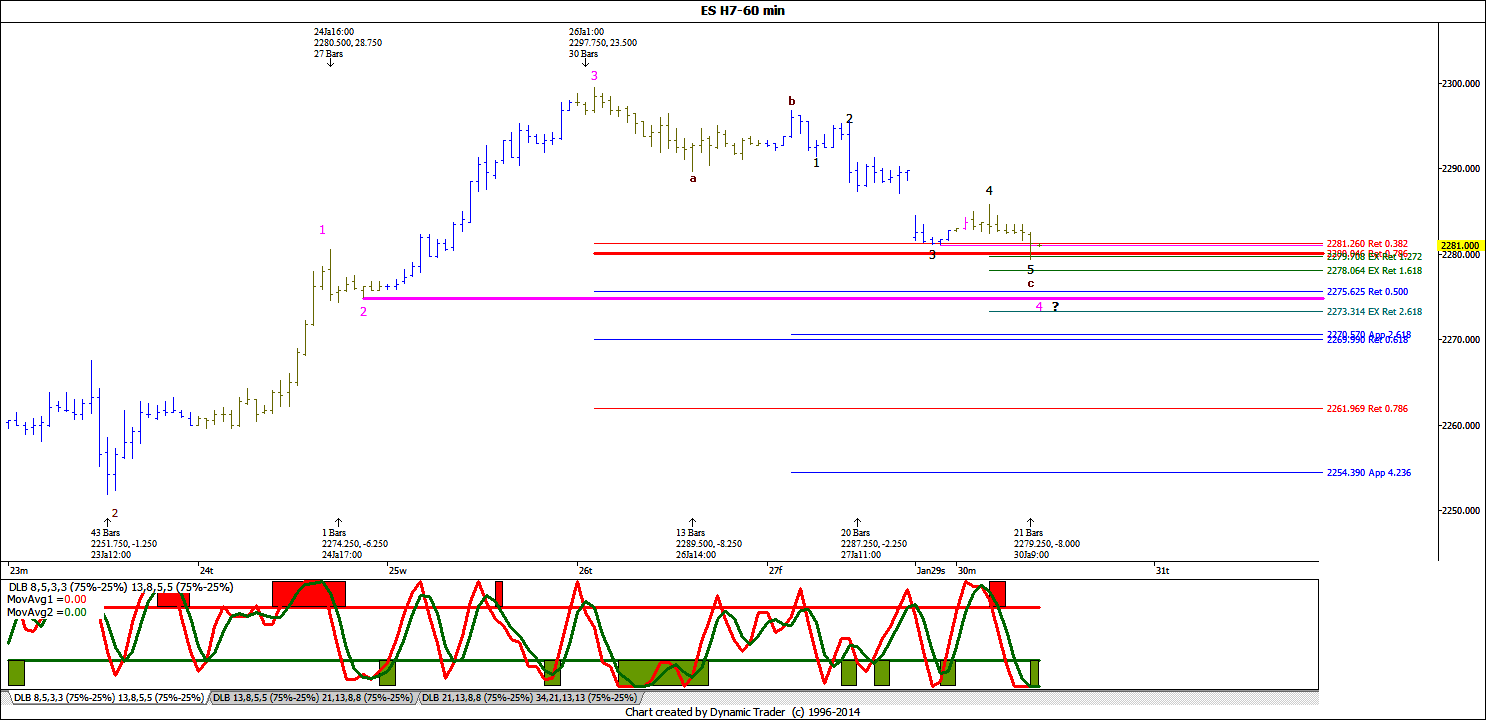
$ES_F 60 Minute Chart Traget – needs to hold
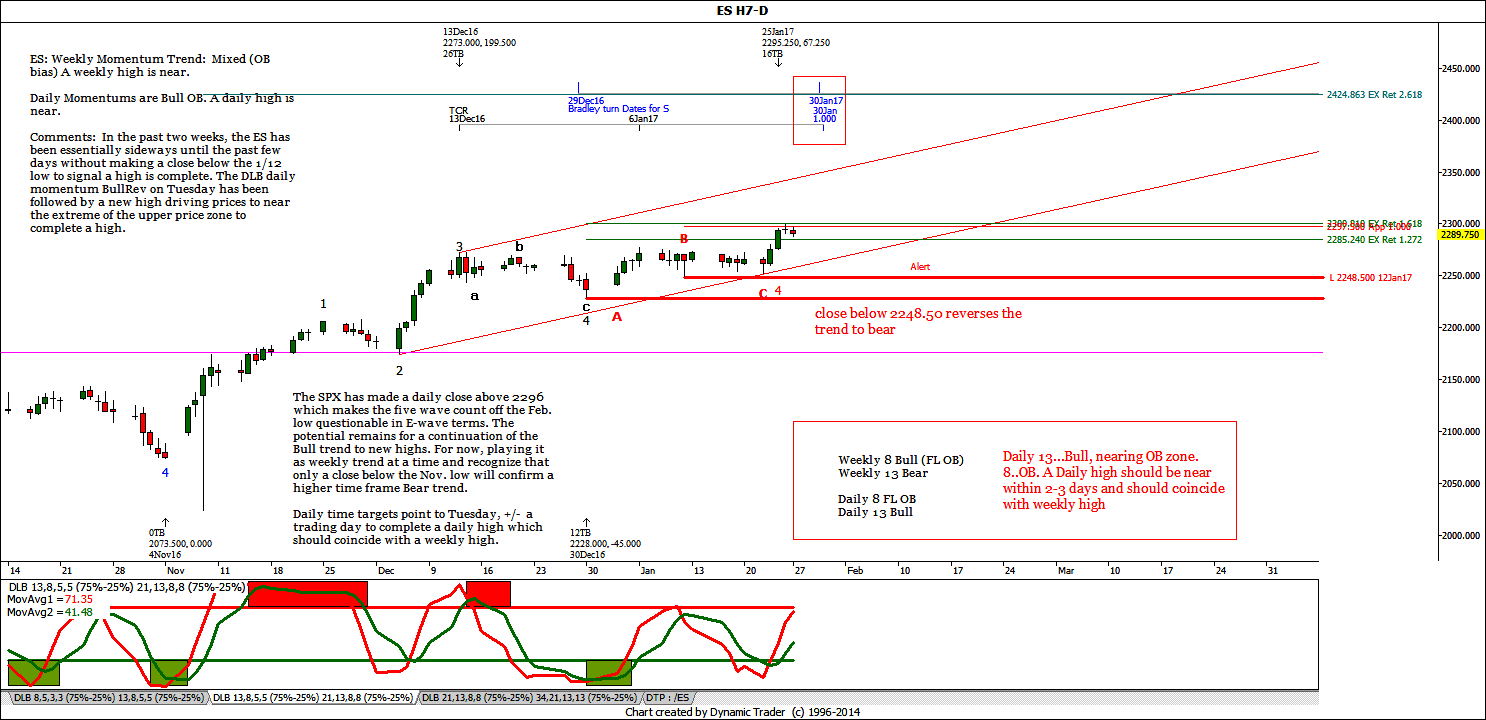
$ES_F Daily chart
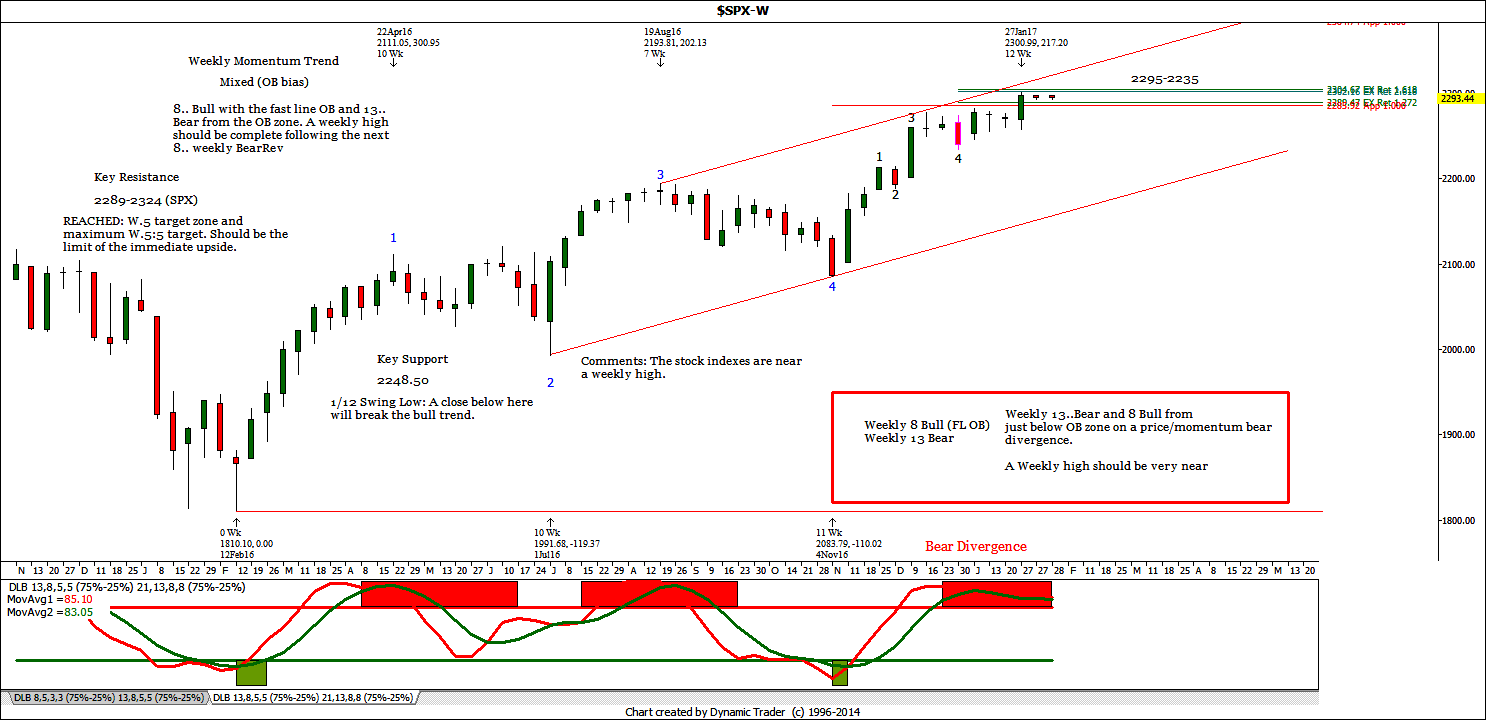
$SPX Weekly Update
Geopolitical Events
- Tuesday the FOMC begins a two day meeting. Also on Tuesday a joint ECB and European Commission meeting will meet and a Bank of Japan Rate decision is due.
- Thursday the BOE will release its latest interest rate decision.
- Friday EU Heads of State will meet. Federal Reserve Chicago President Charles Evans will speak on Friday to finish out the week.
Economic Releases
Releases of note this week include the weekly chain store sales, oil/gas numbers, mortgage applications, jobless claims and personal income, Chicago PMI, consumer confidence, construction spending, ISM Manufacturing PMI, Q4 Productivity, nonfarm payrolls with the unemployment rate and factory orders.
Earnings Releases:
Notable releases include $EPD $GGP $AAPL $XOM $FB $MO $AMZN $V $HMC $PSX – Join our Group for earning trades
Economic News:
Monday, January 30:
- December Personal Income is due out at 8:30 a.m. EST and is expected to rise to 0.4% from 0%.
- Markets are closed in China for the Lunar New Year. South Korea, Taiwan and several other Asian countries are closed for trading as well. China is closed until Friday.
Tuesday, January 31:
- The Bank of Japan rate decision is due.
- The S&P/Case Schiller Home Price Index for November is due out at 9:00 a.m. EST and is expected to drop to 5.0% from 5.1%.
- January Chicago PMI is due out at 9:45 a.m. EST and is expected to rise to 55.5 million from 54.6.
- January Consumer Confidence is due out at 10:00 a.m. EST and is expected to fall to 113 from 113.70.
- The European Central Bank (ECB) and European Commission will hold a joint meeting in Frankfurt.
- The Federal Reserve Open Market Committee (FOMC) begins its two day meeting that concludes on Wednesday with an interest rate announcement.
Wednesday, February 1:
- ADP Payroll for January is due out at 8:15 a.m. EST and is expected to rise to 165,000 from 153,000.
- December Construction Spending is due out at 10:00 a.m. EST and is expected to fall to 0.30% from 0.91%.
- January ISM Manufacturing PMI is due out at 10:00 a.m. EST and is expected to rise to 55 from 54.70.
- The first Federal Reserve Open Market Committee (FOMC) interest rate decision of 2017 is due out at 2:00 p.m. EST.
- Monthly Truck and Car Sales are due out at 2:00 p.m. EST. The only short squeeze of note in this space is Tesla Motors (TSLA).
Thursday, February 2:
- Challenger, Gray & Christmas Monthly Job Cuts are due out at 7:30 a.m. EST; last month they rose 42.2%.
- The Bank of England (BOE) is out with its latest interest rate decision before markets open.
- Q4 Productivity is due out at 8:30 a.m. EST and is expected to fall to 0.9% from 3.1%
Friday, February 3:
- January Nonfarm Payrolls are due out at 8:30 a.m. EST and are expected to improve to 175,000 from 156,000. The unemployment rate is expected to remain at 4.7%.
- December Factory Orders are due out at 10:00 a.m. EST and are expected to rise to 1.4% from -2.4%.
- European Union Heads of State meet.

by Carlos Narváez | Jan 9, 2017 | IKE, RQLAB
If we said that we under performed last week we would make an incorrect statement and that’s a helpless approach, instead we would say that our calls for higher on indexes were right and we managed to balance our cash flows through our exposure to NQ which in summary is bigger than our exposure to IWM. This does not negate the stalling situation in which IWM is but illustrates our healthy allocation of capital.
Saying that, it seems there is an event being priced; the short term razzmatazz wave shows a considerable top was constructed last week and a potential bottom should occur into the 23rd, the indicator might be lagging at this time. The PCR for this week is less informative since it is into standard territory at PCR: 2.839 so this call for a pullback should be valid. Open interest has been one the few indicators that give us a bearish approach for this market.
Nonetheless the Change PCR was executed at 4.266 meaning traders continue betting against the rally, which we consider unnecessary since price is holding above 2236.
The long term razz shows a top into January expiration followed by a very small correction and next resumption of the trend. Looking at immediate SPX pattern, chart here (link) for as long as 2236 holds price should advance to 2362 and 2391. Once market crosses above 2311 we will update our support to 2187. For TNA we will watch the same levels we have been watching 101.05 and 99.95.
Net dollar values are very curious last time we had a D/U ratio of 0.929 combined with a Moores’ 2C-P of 71.20 TNA went from 91 to 107.20. Last value recorded on Friday, January 6th, was 0.893 and current Moores’ 2C-P is 71.10. This means that if prices holds above 100.25 and manage to climb above 105.45 chart here (link) we can be optimistic on TNA.
Cyclical analysis is bullish for IWM into the 16th, chart attached.
SHAK
The only explanation for this pullback on SHAK would be that we made a mistake on the count and labeled it wrong. So we can rework it this way chart here (link), if that is the case, support should be 35.30 and 34.26.
NUGT
For as long as 7.55 holds we could expect one more high to 11.18 in the form of wave 5 of 5 of (1), that would be a perfect fibonacci pinball.
NQ Stocks
$AMZN: Support is at 776.19, target at 822, support is buyable.
$AAPL: Support continue being 116.56. Target at 122-130
$FB: Support is 120.19 target is 128
Charts on $SPX/$ES_F updates from our Chat Room Make sure to Join to stay updated..
$ES_F Daily

$SPX Weekly


by Alpha | Nov 28, 2016 | IKE, Market Update
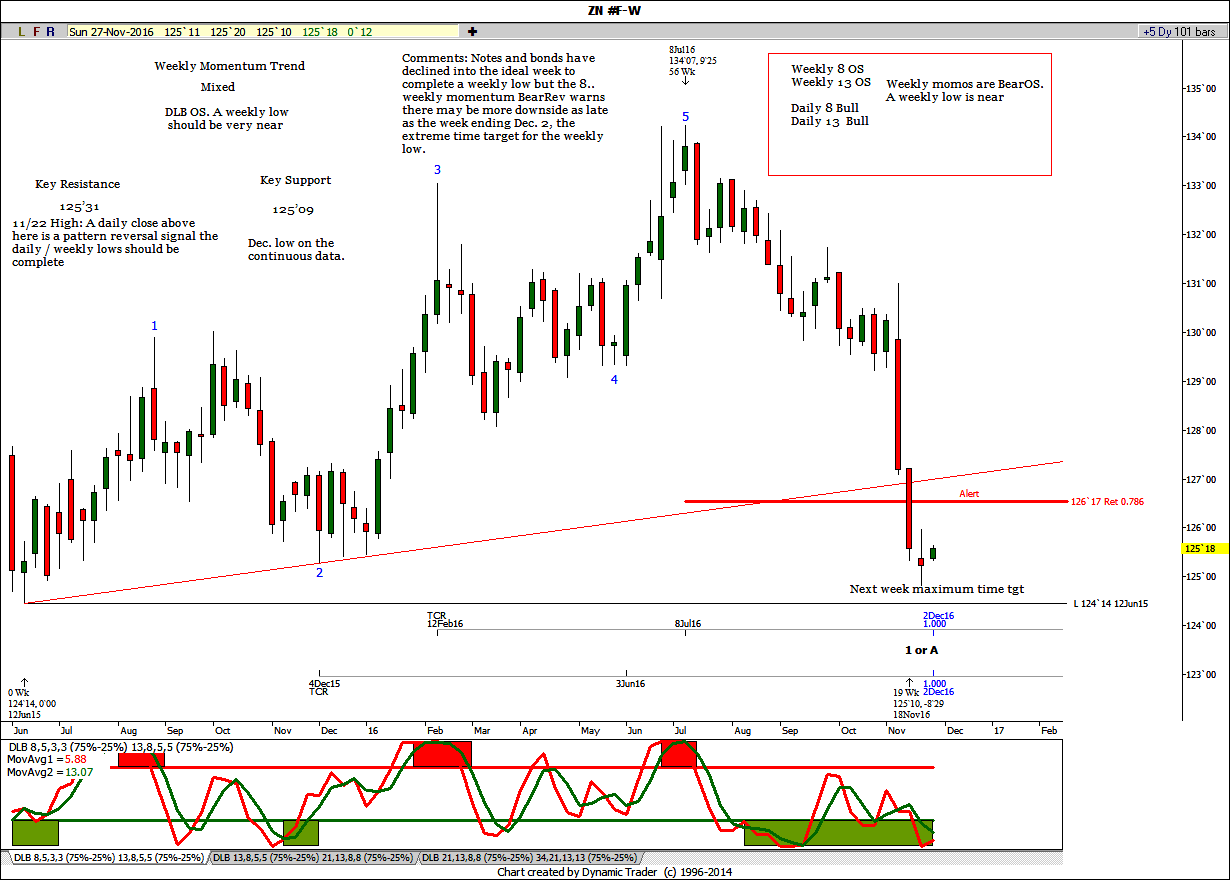
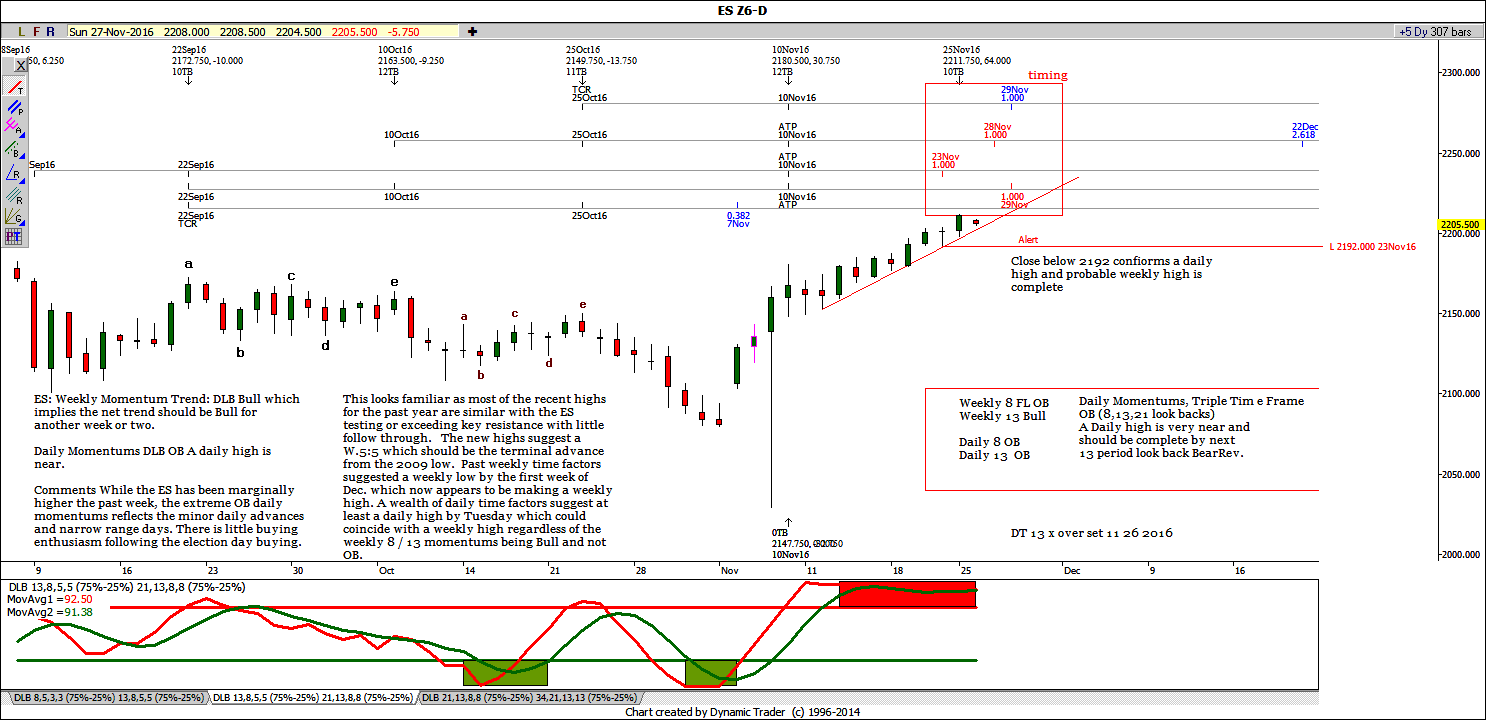
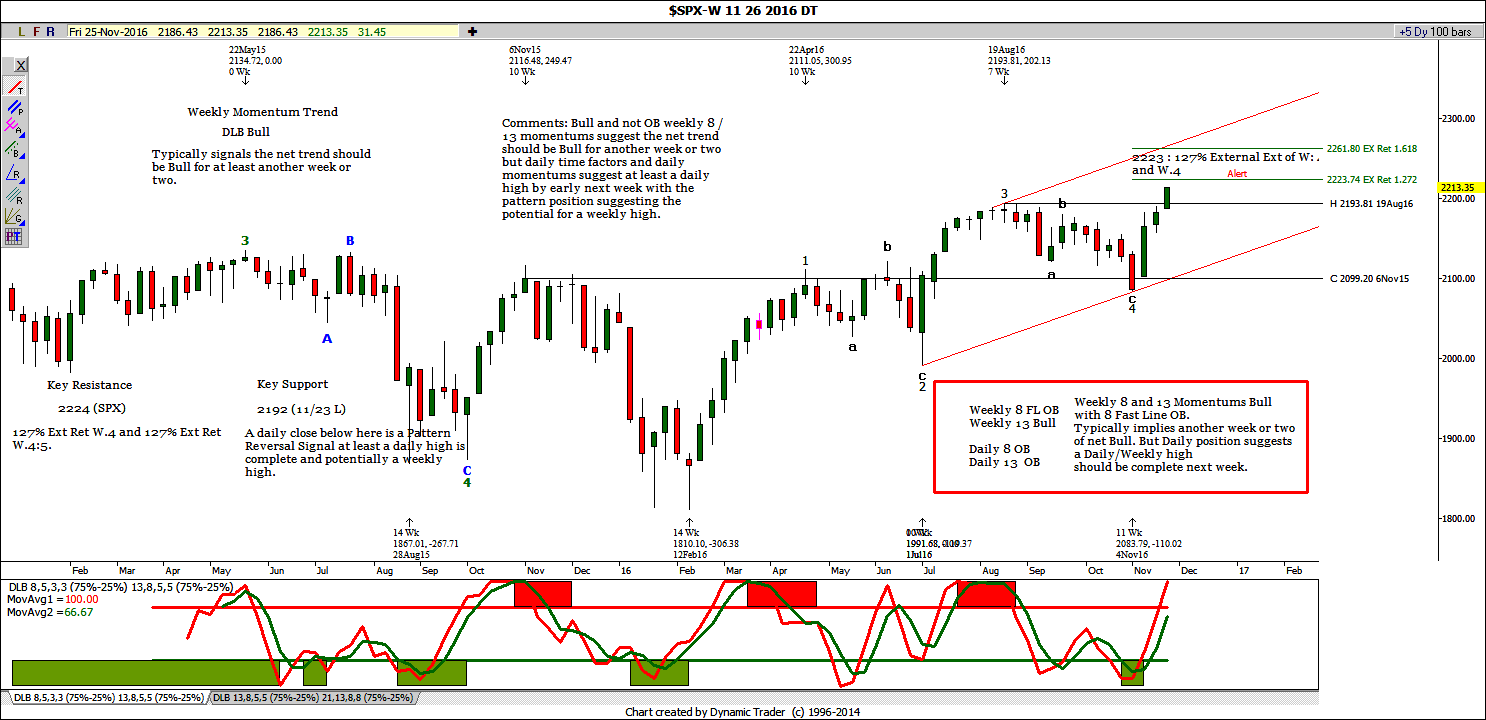
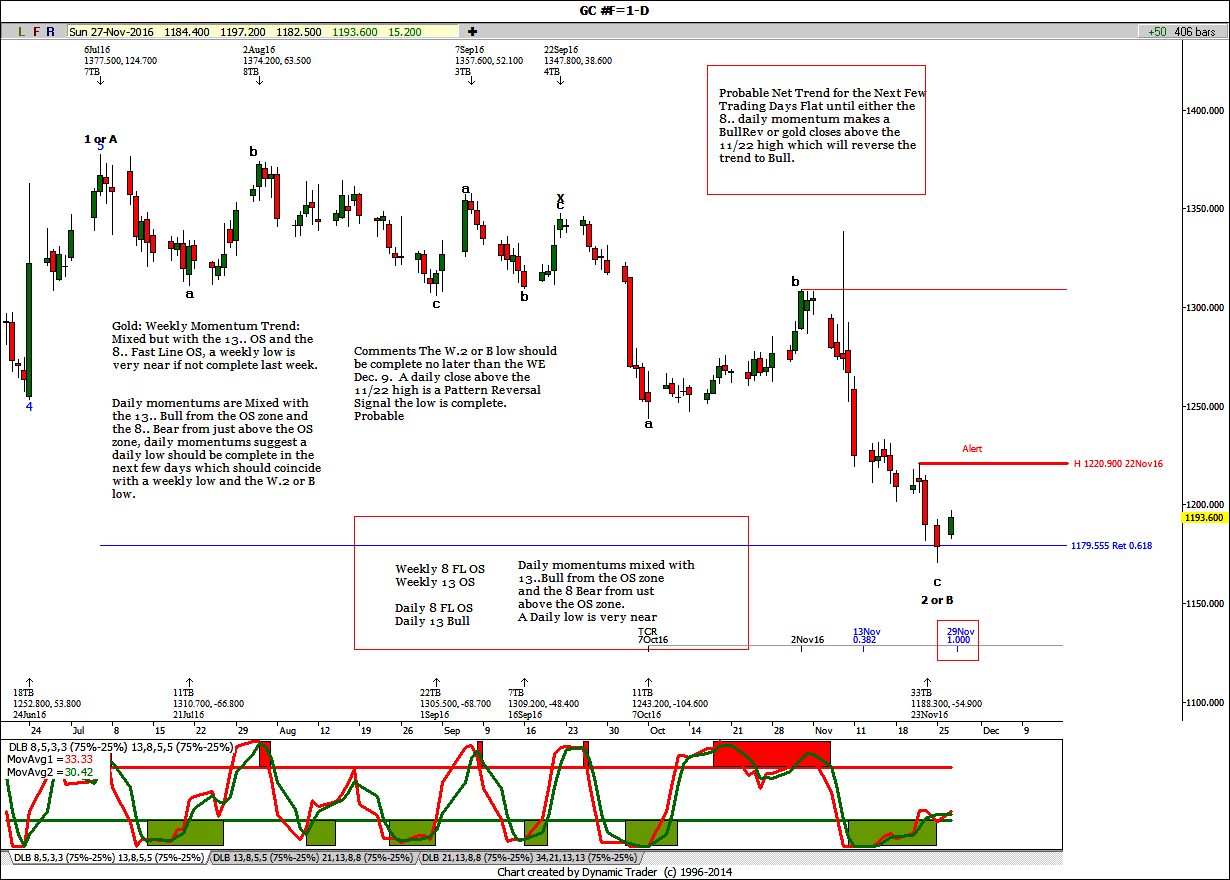
The following charts provide some details on how major US indices are setting up!! Please check us in the room for further details, trade setups and ideas.. !
$ZN_F Daily Chart
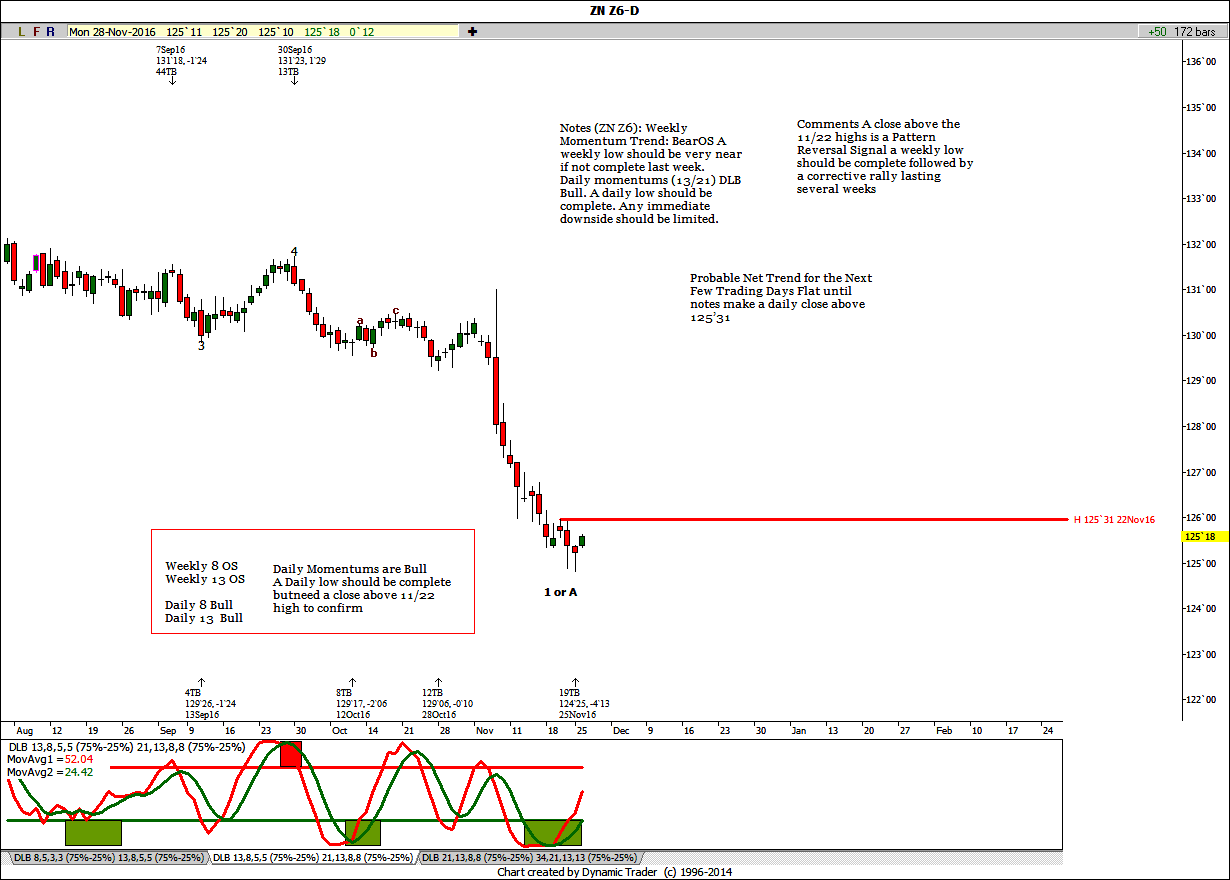
$ZN_F Weekly Chart
$ES_F Daily Chart
$SPX Weekly Chart
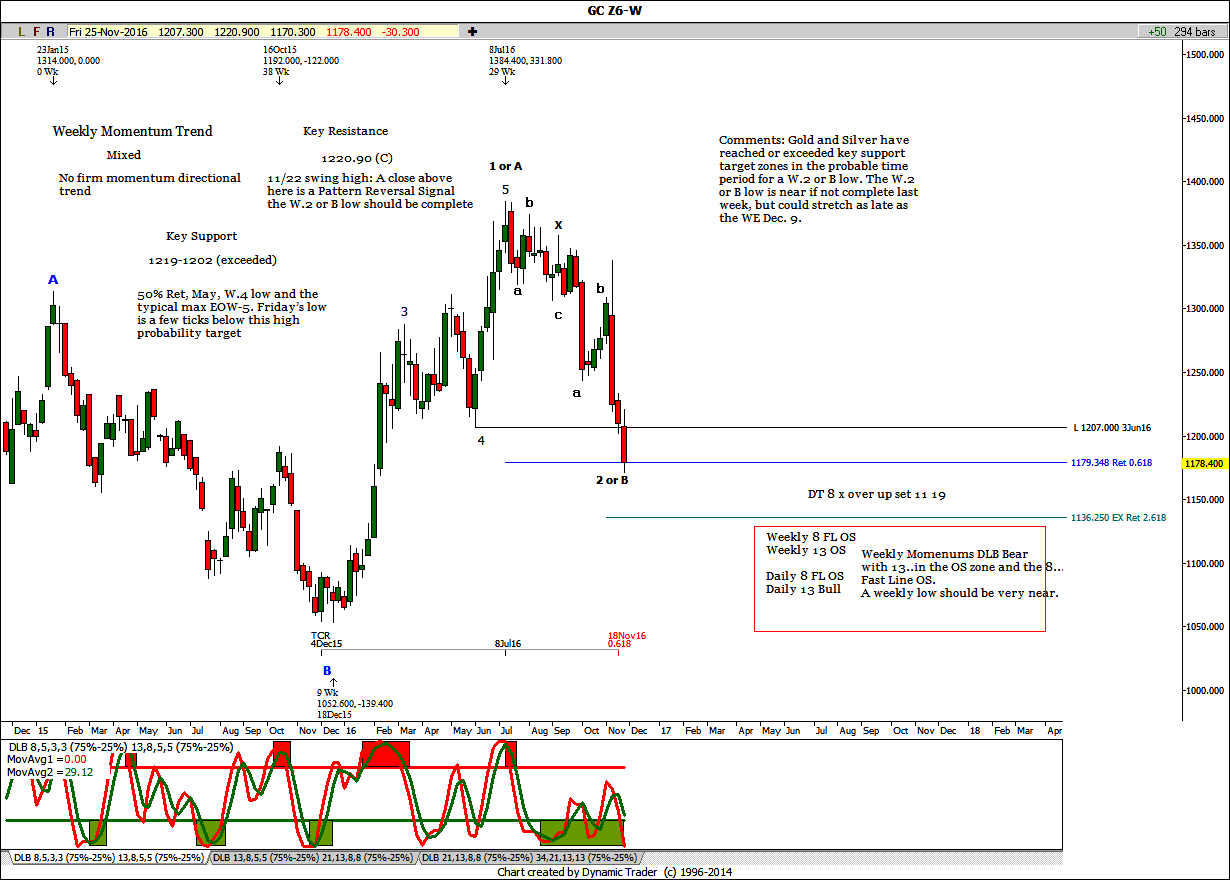
$GC_F Daily Chart
$GC_F Weekly Chart
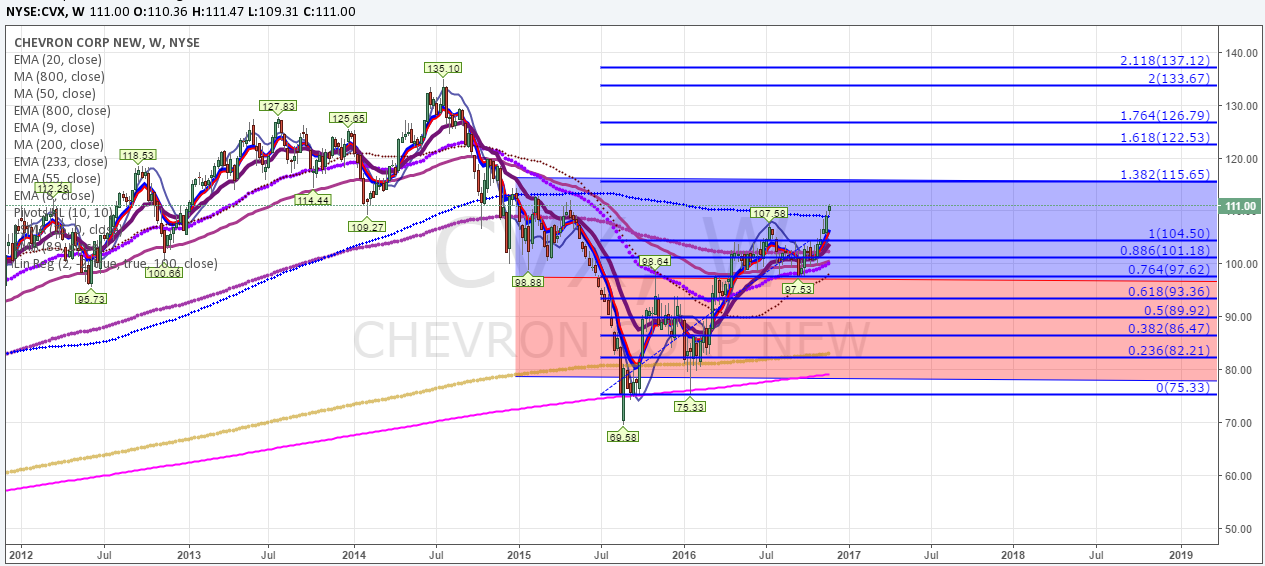
$CVX Weekly Chart
Thanks,
IKE

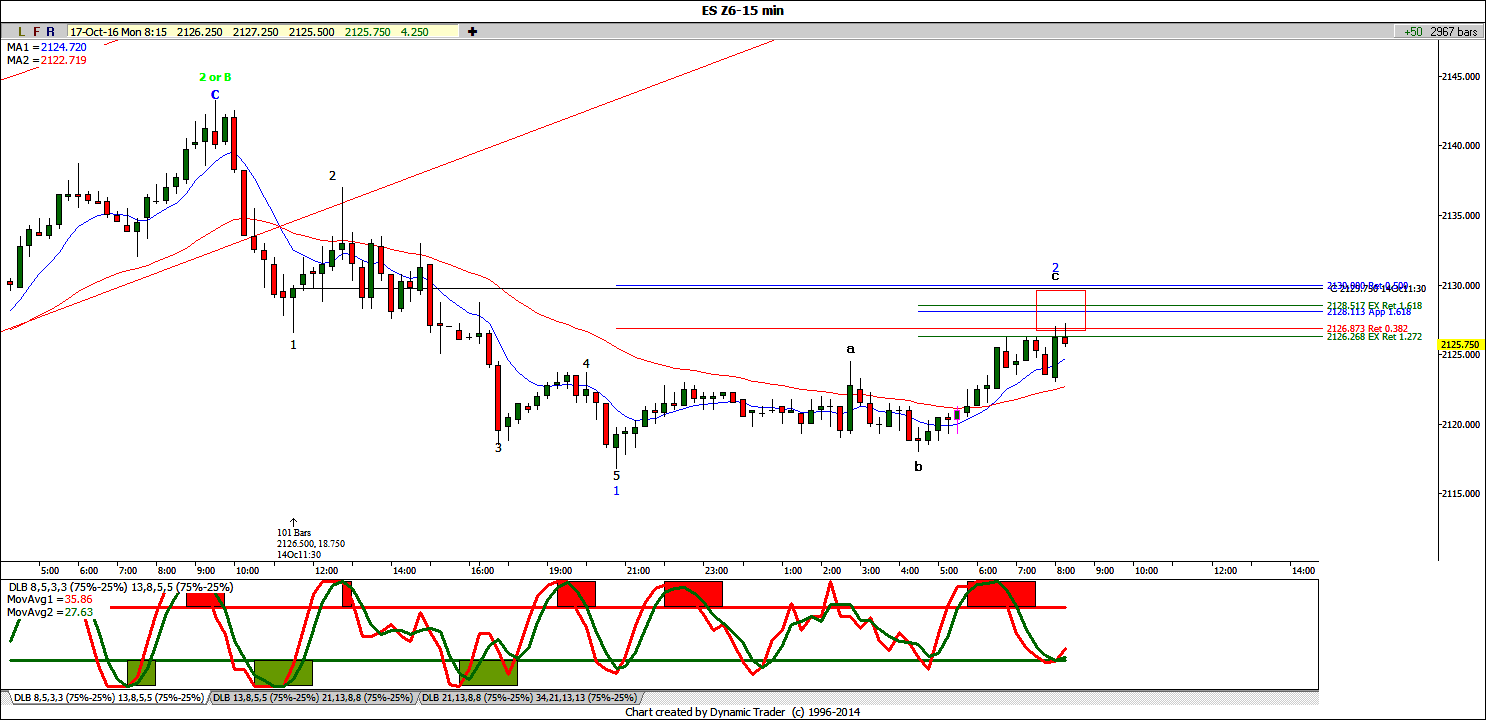
by IKE | Oct 17, 2016 | IKE, Market Update
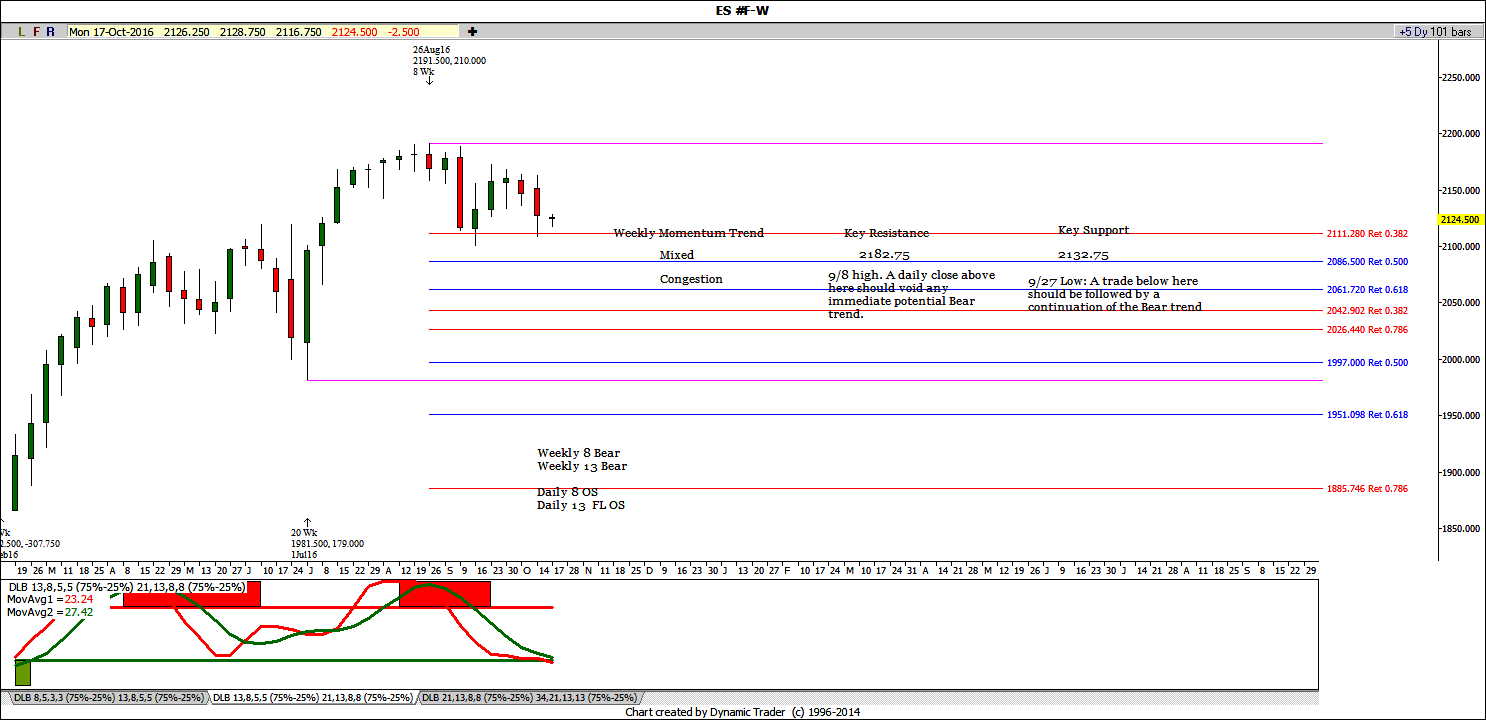
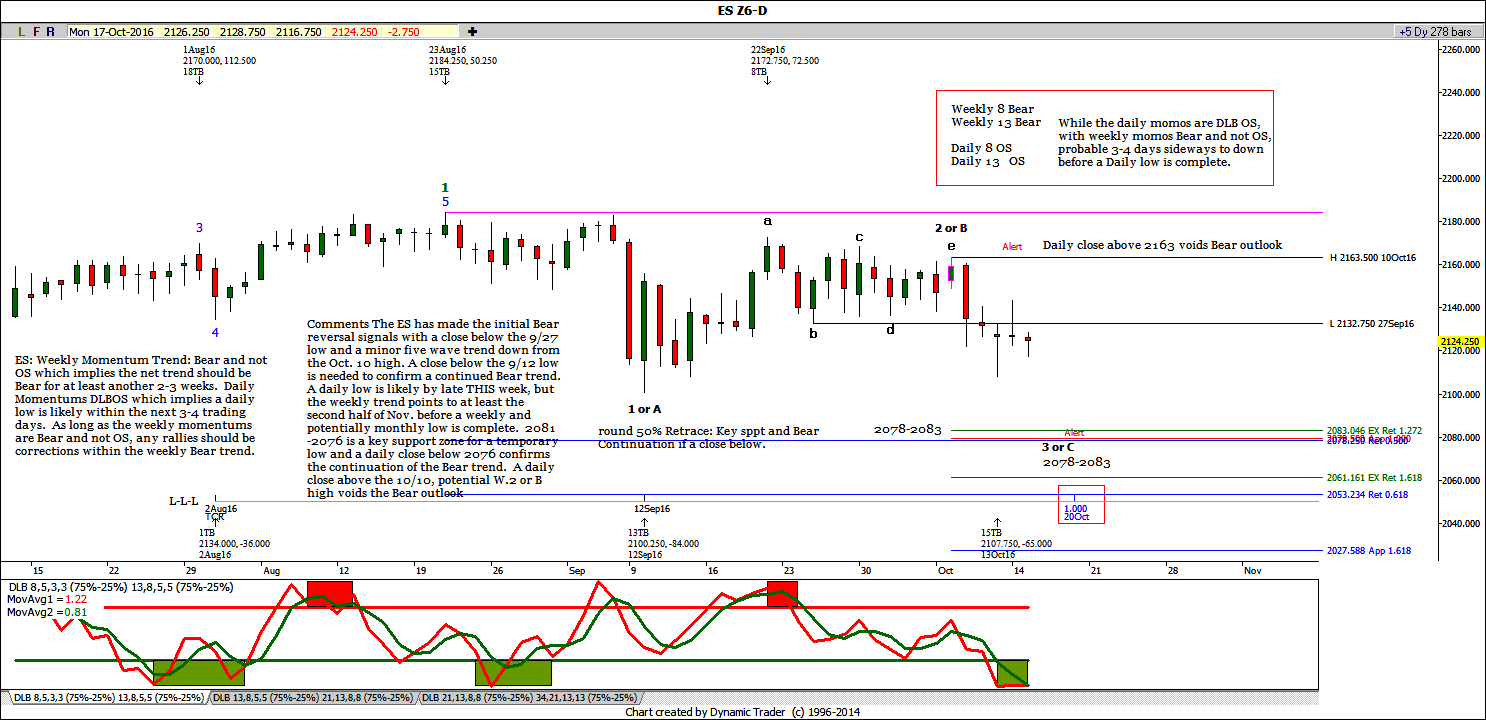
Looking at the historical charts for $SPX, it has broken down, major support areas, with possible Wave 3 or C target 2078-2083 on $ES_F .
A weekly SPX close below 2099 should signal a Bull Breakout failure and the onset of a BearTrend well into 2017..Will this happen I do not know but the technical setup is there
$ES_F Weekly Chart
$ES_F Daily Chart
$ES_F 15 Minute Chart for a trade with good Risk Reward possible target 2083 , unless high get taken out
If you enjoy the content at SeekingOptions, please like our Facebook page and subscribe to our Youtube Channel
See you in the chat room
Thanks
-IKE


