by Carlos Narváez | Mar 31, 2017 | RQLAB
QSR, stake 4.17%
Daily buy on the 23rd. Still on a weekly sell though. Not the cleanest of the charts. We could make the following assumption, first this chart (link) where upper support is 53.81 and must hold support is at 48.26, projecting 64 target, since it is not very clear set a second alert at 51.97, that would be the 1% in the subdivision of the move up (link). All in all tracking the lines where it reacts from in order to have a more clear view of the counts, but nothing bearish here at the moment.
SIRI, stake 82.37%
Nothing bullish yet, support is 3.67, (link)
SNY, stake .15%
Ideally should see a retrace to 41.95, stops at 39.48, above 46.38 scenario will improve. Under 39.48 definitely will not be constructive. Something to have on our radar, very complicated but working toward being bullish
TMK, Stake 5.35%
A 3rd wave can continue extending until it doesn’t, this is the case for TMK, insurer company, upper support is 72.93 and at this moment a break under 59.40 is necessary to reassess any ubber bullish case (link). Next extension is 88.45.
UAL, stake 8.89%, long term top at 88.70
One of the few working on a long term top (link) risk reward is diminishing fast on UAL. Under 57.11 probabilities for a major top struck increase and we should look for a bottom at 39.80, until this 57.11 is not broken still can work to 88 it is not enticing anymore.
UPS, stake .01%, Does not look good
Still early to say UPS has truncated and with only three waves up one should be careful, stops under 98.77, longs above 99.96, Targets at 122-132, but careful with this setup.
USB, stake 4.98%, upper support at 49.42
Something to watch very, very close, initial support at 49.42 ideal retrace at 33.62, huge for a big bank, got us really interested.
BAC.
Similar to USB, under 22.38 trigger our alerts, and we will turn cautiously bearish on banks all banks; if USB and BAC start to show weakness. Once BAC breaks 22.38 must maintain above 18.40 times, failing to do that we will start looking at least for 15.71 area .
WFC, stake 9.49%
WFC weekly sell on Mar 24th.
Ideally should see 64.54, but that is not guaranteed, under 53.34 should be a clear and loud signal that something is not good, from the moment it breaks 53.34 must maintain above 51.77 at all times, contrary case we must assume a major top has been seen, Banks are not looking healthy here. They look due for a hard correction. We must stay neutral neutral.
JPM
82.50 upper support followed by 76.91; 1% at 78.79 (link) for the standard of the theory. The inner structure tell us we must remain bullish while JPM is above 81.46 (link). Under 81.46 then we must turn cautious and watch average of supports at 68 to make its work. Ideal retrace is 60.98, but rather to watch 68 average of supports.
Did we read 82.50 is upper support and we must remain bullish while it is above 81.46. If so, then those are the upper numbers, no reason to over analyze. Then it is an average at 77.85. And will stop there. Three numbers to watch it is enough.
And will save this chart for ourselves, because that last low was taken by 30 cents. (link)
USG, materials, stake 28.18%
Probably it is still trying to hit 41.96 (link) and should be constructive above 28.13 under 28.13 and is reasonable to expect a pullback to 25.26 which is buyable.
Visa, Stake, .45%
Visa is concerning, very concerning, this because upper support is at 79.75 or a 10% pullback from current levels, chart here (link); 50 moving average on weekly is at 80.97, that level could represent an opportunity, but not so confident this will hold .
Triggered a weekly sell signal on March 24th; Additionally these two waves, that I am labeling as 3 of (III) and 4 of (III) are equal in size.
Will save those charts for ourselves, ubber bullish while above 86.98 (case1), ideal retrace to 79.10 (case2) and 85.58 support (case23) in cae 100 is going to be seen before a deeper retrace.
VRSK, stake .93%
At 20 EMA on the monthly (link) under 76.10 will start considering a major top in place. Needs to hold cyclical .50 retrace at 71.89 to remain bullish long term (link).
VRSN, stake 12.61%
Hitting 2.618 in the macro counts, potential retrace to 64.46 developing, upper supports at 85.70 and 72.43 but nothing to see while above 79.45 (link).
WBC, stake 6.16%
Long term bullish while above 96.04 (link) and I would use 110.73 as stop right now. Best chart until now on BRK.B (link).
WMT the bearish of the team, stake .05%
WMT, nothing remotely bullish on it, not saying it can not go higher, still could go to 106 in a c wave up for final five waves up, but for that needs to hold above 66.53 (link). Would like it above 72.30.
GS, stake 2.80%, in the midst of a pullback
GS was very over-extended, I think support can be found at 213.01, previous 1.618 as seen here (link) standard fibonacci retraces point to 217.95 and max should be 206.46 which is 233 EMA and .50 retrace on the daily chart (link).
IBM, stake 8.66%, close to finish retrace
At .50 retrace on the 4 hours chart (link) soon will be at 1% support, 171.30 as seen here (link).
For the macro count, .618 is at 166.92, but here it is at 233 EMA, this could suffice, but if this does not, next good level for an entry is at 166.92 looking for 206.27 and 212.01 (link).
JNJ, stake .01%, 116.50 directional line
Hard to analyze a stock that has moved up only, will set an alert at 116.50 best I can do (link)
KHC, in the midst of a retrace
Currently on weekly and daily sell signals, potential support is 86.7-87.68 area, good for a retrace.
KO, stake 8.66% support at 38.72
Should see a bigger retrace to 33.19, let’s look at the extensions it has hit (link) 38.72 was 1.382, so it is current support, standard retraces are here (link) 36.28 and 32.92.
LBTYK, stake 1.34%, bullish above 32.57 support
LBTYA, stake 8.66%
Long term should be good, held .5 retrace for wave iv and now seems to be working in series of 1-2-i-ii (link) and for the last i-ii, support is 32.57 where alerts been set, (link) above 35.50 it is constructive for 40.05-41.07.
LSXMA, stake 1.89%, support at 35.99
LSXMK, stake 4.16%
LSXMA, in 1-2-i-ii, so for the i-ii support is 35.99 (link) and for the 1-2 support is 35.32 (link) meaning this 35 ares is good for a long entry looking for 43.72-42.73 a decent stop should be 34.4.
LUV, stake 6.99%, under 47.85 initial signal of weakness
47.85 would signal a sort of bigger pullback is starting (link) 50.35 was previous 2% extension but 47.85 is .886 retrace of the inner structure (link) ideally should not break under this line (47.85), holding it and breaking above 54.08 easily can go to 66.51-69.45.
MCO, stake 12.88%
Actually the pullback that MCO had at 83.49 was very healthy for such a tremendous move up, still chart points to 125.57 and 135.51, but that is only a 11-20% return, right now upper support is 110.72 and a bigger retrace could take it to 101.77, so far is holding upper line here (link)
WDC, (ours posted in SeekingOptions.com chat room)
WDC, 2.618 in the blue count is 94.46, level that we have been looking for some time, we would consider that this 94.46 is achievable while 72.52 holds, under this area and losing 70.21 it would be a clear indication that standard retrace to 62.71 will be seen (link). Additionally 75.27 should be stop for any aggressive long a the moment. (link)
MDLZ, no call
Has been consolidating for three months now, 8 EMA at 42.2843. Have st an alert at 40.50, best we can do with this chart is to watch.
MON, stake 1.83%, bullish
Ideally should top at 146.96 (link), immediate support at 111.95 and if completed five up could go to 97.74.
MTB, 3.50% a lagger, banks
A serious lagger, a serious lagger, not even 1.764 it’s pears got two or three more extensions, M-line at 146.64, standard retrace at 131.43, no call, should go up more before retracing. Charte here (link).
PG, stake .01%, very bullish above 81.56
The retest that PG did of the 81.56 lines is very telling, monthly chart here (link) so, for as long ast this 81.56 holds we must consider PG one of the best setups in town with a 40% reward at a minimum.
American Airlines, AAL; 8.80% stake, bullish
At 50 MA on the weekly and .382 retrace of the entire move up as seen here (link) and .618 of potential wave 4 that went very deep because wave 2 was non existent (link). For reference and in case evolves into a major ABC; .618 of the entire move is at 37.80
American Express, AXP; 16.85% stake, bullish
Continue to be an overweight position, right now stuck at LSMA (link) but while it is above 74.19 is very bullish in the long term. Here it is at 50 MA on the monthly (link) had a daily buy signal today, Friday, March 24th. Above 78.47 daily 50 AM would look better
Axalta, AXTA, 9.963% stake, bullish
Dramatic support at 30.36 on the weekly, as seen here (link) 29.81 is previous resistance now support, 38.2 retrace is 29.69 also -162. For the alt 1; .50 retrace is at 29.14 it is a perfect stock in Buffett’s portfolio.
New York Mellon Bank, BK, 2.09% stake, cautiously bullish
BK is under a sell signal on the weekly; a move under 40.87 would be initial that a major top is taking place, but for as long as it manages to retain 44 level, it is conservatively bullish as seen here (link).
CTHR, 3.49% stake, no call
Tentative buy triggered today Friday, March 24th; M-line at 292.91 where alerts been set, dramatic move up .
COST, .99% stake, bullish
COST, Under a sell signal and SAR sells on weekly. W-line channel holding though. GFG between 162.06 and 158.51, based on this and micro pattern, I like 160.83 for a long with target at 191. (link)
DAL, 7.98% stake, bullish
Very good for C of 4 here with target for 5 at 55.87, (link). Very close to 50 MA on weekly at 43.23
DNOW, 1.68% stake, slightly bearish
Daily buy signal today Friday, March 24th, but under .618 retrace at 16.42, I would like a move above this 16.42 to try a long (link).
DVA, 19.65% stake, bullish
Under a weekly sell signal but comes from ideal retrace for wave iv in the entire structure as seen here (link) I have set 2 alert one at 62.32 and one at 70.14 if 62.32 is seen I would think it is wave 2 of ((5)) and above 70.14 something more more bullish with targets at 74.50 or 82.
FOXA, .48% stake, bullish
Weekly buy on September 2016, not bad, but too complex and small exposure, would be enough to watch 28.12 and 32.42 (link), for an immediate long would use stops at 30 looking for 33.25 and 38.70.
GHC, 1.94% stake, bullish
Long term, we should have our eyes at 548.42, chart here (link) if could have a retest of this level we could project at least 718 as target. If we are not that lucky, needs above 587.15 to signal at least 635 will be seen, we would like a test of 548.42 would be a gift.
GM, 3.35% stake, very bullish
Daily buy signal today Friday, March 24th, at 55 EMA and 200 MA on the weekly, so it is a sweet spot, if that was not enough it is at .618 support for a 3rd wave to 46.28, chart here (link) and 1% retrace for 4 of wave ((3)), chart here (link) with wave 5th of ((3)) to follow next. Very decent setup.

by Carlos Narváez | Feb 15, 2017 | Business, RQLAB, Technology
Few years ago many analysts and traders made many bearish calls against $AAPL stating that its best days are over! What did we do at Seeking Options? We believed in the story is intact and that Apple ($AAPL) can innovate, which will reflect into higher prices in the stock. With our Bullish view we have placed many trades on $AAPL in the last couple years, keeping our Core Long position.
Apple has many sources for it’s revenue starting from the iPhone taking the lead, as it has sold over 1.2 Billion Unites in its first 10 years, making it “the most successful product of all-time”, in addition to its other great category products like iPad, IPod touch, Apple Mac Family, Apple TV and Apple Watch.
Not forgetting its great balance sheet, as the company keeps on generating more great return to its long term investors. Apple qualities makes it stand the test of time against every rival “iPhone killer” that comes along. Their great IOS and Apple ecosystem that keeps people locked in, as well as the many capabilities of the iPhone and its reputation as being the premium smartphone choice. So With all that, can Apple hit the 1 Trillion Mark? Probably why not? Would it happen this year? That we don’t know.. but lets look at some Technical Charts.
Standard support for AAPL at 125.57, max standard-acceptable support for $AAPL 122.26, as shown below
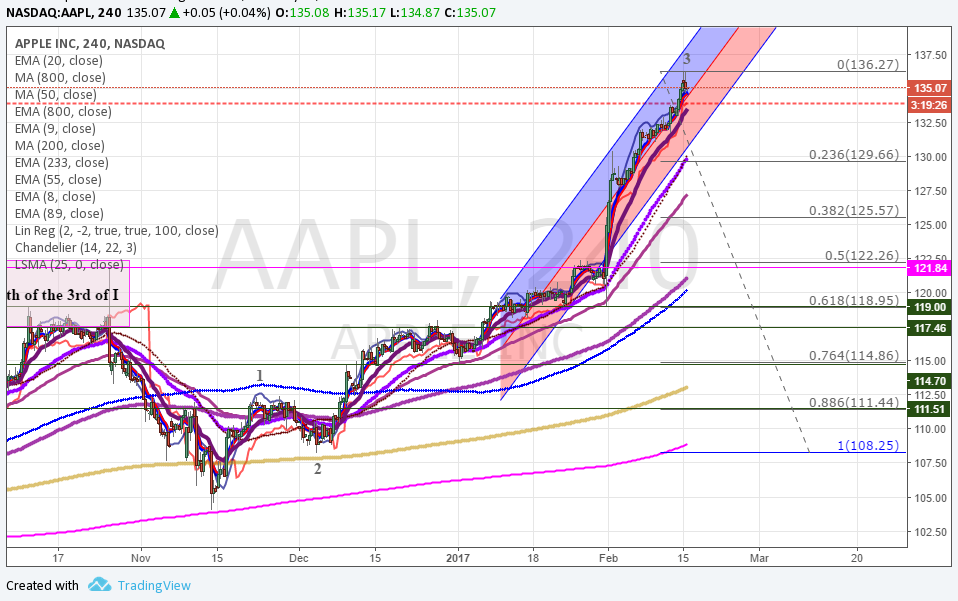
Fibonacci’s extensions proper for $AAPL
Based on its intrinsic behavior we will lower initial upper support for AAPL to 131.08 as seen on the char below and we will favor this upper support over the supports mentioned above. We will set next support for AAPL at 124.41, just let’s remind, upper support might be enough.
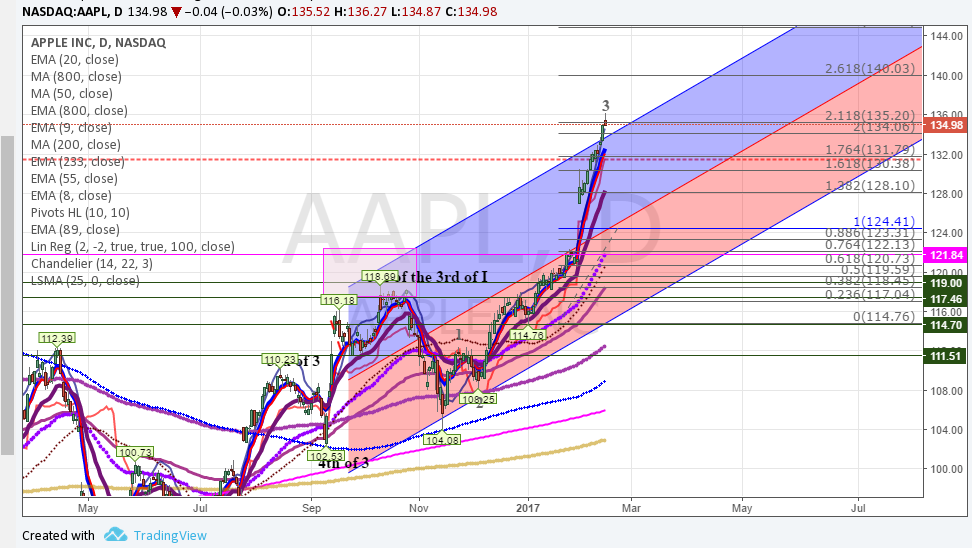
Next Targets
Finally but not less important, 124.29 is the alternative support on the chart below. All in all 124 area seems to be enough for all the scenarios we track but let’s not forget to add from 132 to 131 the initial position.
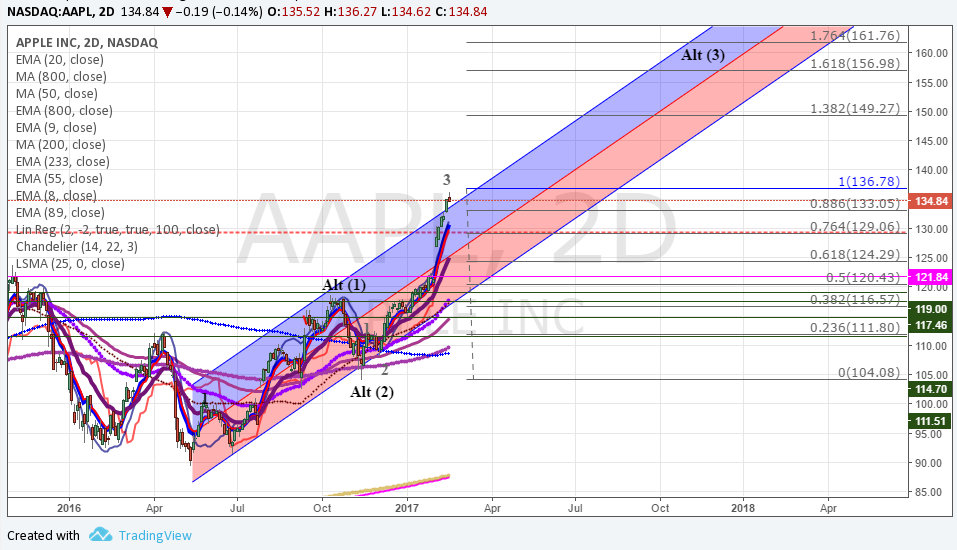
For targets and while 122.26 holds at a minimum 141.95 should be achieved; alternative (Alt 3) approximation points to 156.98 as reasonable probable target.
We have placed many trades in our Chat Room Feel Free to join our chat or Join our Club for more Trade Ideas.
Other Updates…
BRK.B
Standard pattern should be this (link) where the 5th of 1 should have topped at 166.50; if this the case 162.22 becomes support for wave 2 (link) and with stops at 158.61 we could expect 171 as minimum target with standard targets at 176 and 178.
If price decided to take a faster path to 172 then must hold 166.23 or .618 extension on this chart (link) in a more aggressive 1-2-3 pattern
$SPX Weekly Credit Spread Trade closed this week with 50% profit, with 28% YTD Profit 100% win trades
Give it a Try!!


