by Carlos Narváez | Dec 21, 2016 | RQLAB
$TNA
Moore’s 2C-P came down today to 79.50, falling 6.47% while SPX was barely up .39%, this is a nice divergence at the highs, and would strengthen our cautious but bullish approximations, the divergence could indicate we’ll see more sideways consolidation before the market can gain some traction to new highs, is not much but indicates traders are bearish this market while it moves up.
FNG’s cyclical analysis is still looking lower into the 21st, but with cycles so oversold we question how low the market could go before starting to rally.
We would have liked TNA to hit 107.80 or 1% extension to add more certainty to our projections, but as seen on this chart (link) we came too close to .886 retrace; for tomorrow reasonable probable target is 108.50 or 1.382 extension for this overlapping i-ii-iii-iv-v, chart here (link), above 108.50 would suggest 109.07 is solid target to sell the trades; 109.47 is possible but not reasonable probable.
$GE
32.57 is next ideal extension for GE, support should be 31.85, once at 32.57 we should consider 32.47 as support.
$IBM
Two potential counts
First approach: If in 1-2 of 3 for 184.50, support for IBM is at 162.05, chart here (link). Breakout line should be 170.62 with support at 167.83.
Second approach: it’s a blue count, difference is we added a zero and we consider this is macro move with a running flat for wave II, ideal support is 159.08, as seen here (link), breakout extension is 171.72 with potential resistance area at 177.36, the change would be that in this count we should modify target to 195.64.
Looking at the weekly, please notice how 172.47 and 181.11 were huge resistance in the past, chart here (link), so we can take clues from First Approach and consider any pullback that holds 167.83 as buy-able for 181-184.5.
Obviously it would be better to buy standard retraces at 162.05 or 159.08, but in case they don’t materialize we should try to buy according to price action at the breakout and support levels that we mentioned.
$VRX
I will post this chart for VRX here (link) still needs to print five waves up, ideally at 15.33, support for wave iv goes from 14.19 to 14.11. We will assess the retraces after 15.33 is hit to determine how bullish VRX could be.
To View #RQLAB please join our club

by Carlos Narváez | Dec 16, 2016 | RQLAB
No much to say for the day. Market managed to break above 102.3 and accelerated to 105.14 in what could be considered a “b” wave top with .618 extension at 105.65, chart here (link). This 105.65 is still ideal target, with next achievable level at 107.53 and still would be a b wave.
Despite apparent strength price was still unable to go above our 106.33
On the downside; once price break 99.95 low reasonable probable targets are 96.32-45.44. Chart here (link)

by Carlos Narváez | Dec 14, 2016 | RQLAB
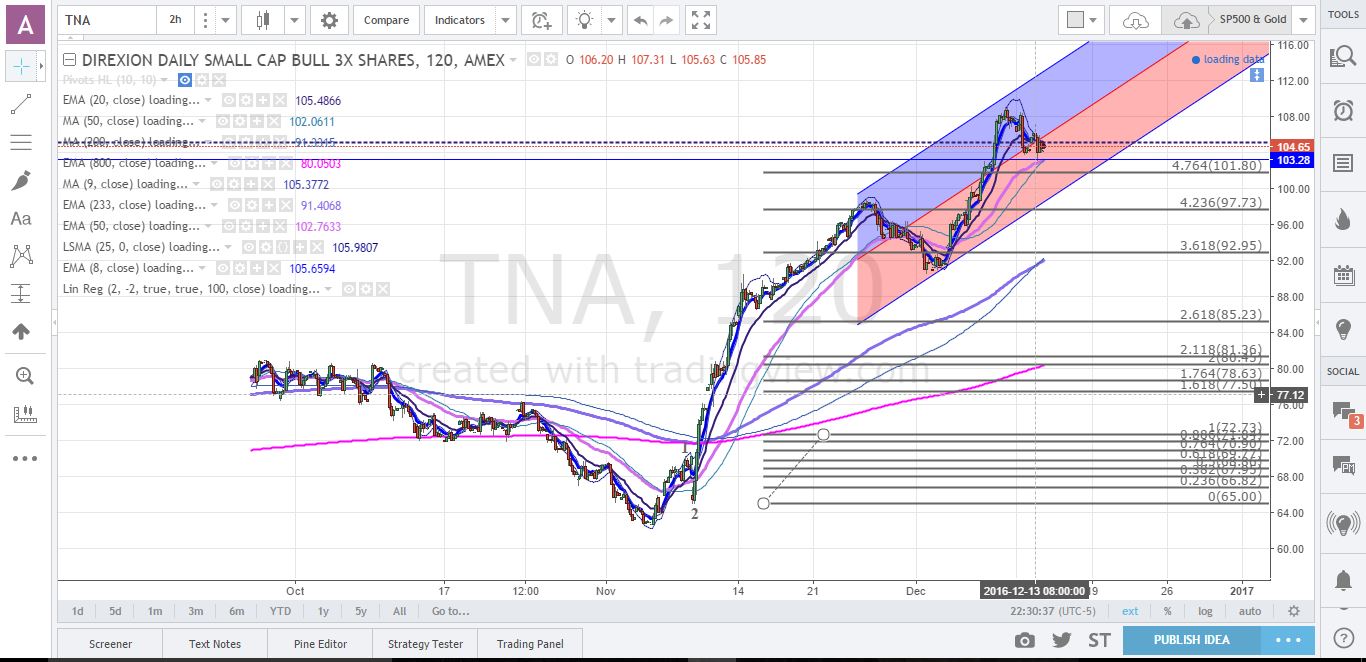
Our considerations for a bottom in $TNA once 106.97 was taken was wrong, market tried but failed and retested 103.38-102.85 support area as seen here (link) and today’s action open a clear probability for a retest of 101.90 support, chart here (link) very close to previous 4.764 retrace from the following Chart:

On
November 9th, we expressed our reluctance to chase a 5% move on $TNA for 113-114 but established the parameters and stops to enter a long trade in this area 103-102.80. We are proceeding as planned. As an additional note it is worth to mention that a successful retest of previous Fibonacci resistance more often than not leads to a move to next extension and that’s 117.72 for $TNA chart here (
link).
We are not bullish or bearish about this market, we have maintained a successful but neutral approximation. So for tomorrow 101.90 is going to be the line we will be watching to add to our longs. Stops should be considered under 100.31.
Addendum, December 9th, update for $TNA
From 91.76 support TNA managed to climb 19% to yesterday’s highs at 108. We have had 108-114 as targets areas for about one month in our books and we have been trading the long side based on the micro patterns.
The question we ask now is, should we be chasing the last squiggle to 113.46 or 5% more in the upside? The answer depends, ideally we should get a pullback to 102.88-103.38 as seen here (link), in case we have this micro pullback, stop for any trade entered at 103 area should be 100.30 with potential target at 110.45-113.45 and this is a decent risk reward. In any other case we are reluctant to chase a 5% move to the upside, simply because if market starts to correct, standard retraces for support are 87.35-80.42 and this move has been so fast that from here to 98.76 there is only air to support a correction.
For any trade chasing 113.46-114, hard stop should be 106.25
#RQLAB

by Carlos Narváez | Dec 13, 2016 | RQLAB
XLF :
We still can squeeze 25.11 on XLF with resistance at 26.74, this upper range is reasonable probable for as long as 23.17 holds. Chart here (link).
OIH :
Ideally, but not necessarily should pullback to 32.18-32.76 support is 34.35, previous .764 retrace. Chart here (link).
CPA :
We will update support for CPA to 92.87, stops at 87.69 and targets at 117. Confirmation of target comes once CPA breaks above 99. Normally we would set target for CPA at 107.69, but we have reported previously how CPA behaves, this make us to move our target to 117. Chart here (link).

by Carlos Narváez | Dec 13, 2016 | RQLAB
TNA bottomed at 103.77, so bears did a great job providing a very clean count. For today, should the market advance above 106.97 we can consider bottom is in; 111.22 should be established as reasonable probable target for TNA with potential extensions to 114, chart here (link). So, once again market has made things easier, lowering a potential entry to 106.98 instead of chasing a breakout above 109.18.
STOCKS
On all the following stocks we were waiting for a pullback, which was accomplished yesterday in some of them, should they rally back above confirmation points, trend resumes with good risk/reward ratios:
CMA, still above ideal entry
EXTN still above ideal entry
ENVA, very interesting with this retest of 1% extension
WAC, still we need more price action
TCS: Above 8.34 should confirm uptrend
TCF: Still holding above supports, (link)
JOUT, set alerts at 45.34 to confirm continuation, would not touch it for the moment
BPOP, holding above 43.06 support (link)
CCBG, above 23.15 start to confirm out 28 target
ATW: Above 15.03 trend resumes
Previous Update: TNA on Friday left a nice setup for a pullback to 105.63 and potentially, if bears have some luck into 103.53, fibonaccis here (link). We would like to point out though, that even we have a projection for 103.53 this is not a recommendation to short but to watch for buying opportunities with proper stops. Additionally a test of 101.10 area with strong reversal above 103.53 it is a serious signal that market is ready to extend to new highs. We should not short TNA with conviction here and we should pay serious attention to what the price does at 101, if that level is seen.


