IBM
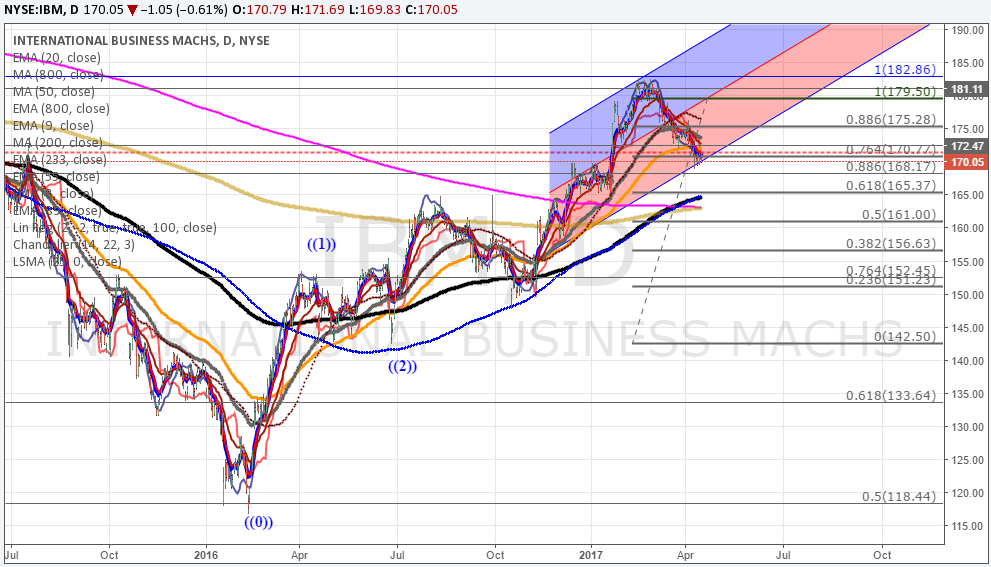
Looking at charts and we see an average of daily a good entry at 156.15 based on our trader system (Joel), that should be the confluence of the supports we see on the daily chart, Level 3 is at 158, so a spike down into this area should be “buyable”. Not sure about a bottom down there, but we could trade the retrace up.
We were expecting a bottom at 165, where others indicators aligned, daily 200 Daily Moving Average is right around daily Level 1 Level 2 support at 166; 164.747 monthly pivot just below them, 164.057 weekly pivot below that. -362 daily at 165.22. Additionally we had bullish .618 at 165 and now it is at .50 retrace at 161 as shown in Chart Below

NFLX
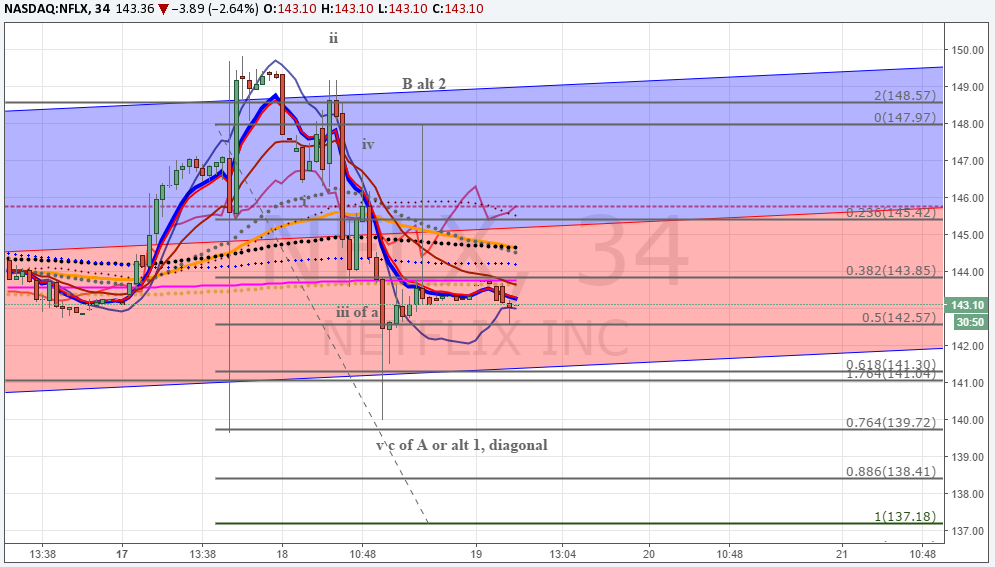
Not too bearish yet, just the usual conundrum; very ABC chart style

Please notice how IRBs bottom at 140 area, meaning institutions are not letting it go, but if these levels fail potentially will bottom at 137.18 and 130, no reason to hold all the position in that case. Other important factor is the bearish IRB at .764 retrace at 147.97 could have completed any potential retrace, first indication that it will break down comes once NFLX breaks under 141.30.

Carlos
You want to trade with us? Try our VIP Room Special

