Should we Adapt, How?
5
April, 2018
SPX
Trading Ranges
Next Levels
NEW Measures
Initially we will degrade the targets of all our leaders and ETFs from 2.618 to 1.618 in their sub-divisions that we do regularly in our live trading rooms.
Second, we will slowly work on underweight our leaders and we will move capital tactically to $SPX and its leveraged ETFs, limiting purchases from now on only if 2400 area is seen or if some parameters are met on the upside, like taking 2719 resistance in something more than 3 waves up. Most importantly, we should cut exposure on Indexes to only 20-30% of our portfolios once we arrive to the 2950 area and we must have cut most of our non essential longs.
Options: Much more importantly, we will limit option trading on companies; we should only trade options on $SPX/$IWM and $QQQ, trading options on companies from now on should be limited to when we are looking for 1% and 1.618 retraces, you have to adapt and limit the way you make money.
If you want to trade options, make sure you are pointing your target at secure 1% and 1.618 retraces, prepare for some companies to get to exuberant levels, but be aware something that goes up 10% today might/will be down 20% tomorrow, you will lose more money than what you intend to make by following something that goes up only by going up.
We will cut our target for the market to 3100 from 3200 and we should only go after the 3,000 level with limited capital, by the time market hits 2950 our only positions should be on indexes $SPX/$IWM/$QQQ.
Now, assuming 2950 will be seen before 2191, some parameters should be met, starting with the fact that the market should not break under 2373 area.
First approach, under 2587 we continue considering that 2420/2375 are targets, 2327 represents .764 below the standard 1%, this is our primary approach, while we think pullback can go below 2420, but we don’t think it will exceed 2327; if standard pullback is playing out. Traders should consider shorts for as long as market breaks and stay under 2587, and continue shorting when $SPX breaks 2506. Round number for this first approach is 2373.9.
“A VIX future effectively serves as a means reversion indicator in that it tells us what the market expects as a mean”- Adam Warner
Conclusion:
Some new rules have been set, bears are right shorting the market, below 2587 we confirm 2506, below 2506 we confirm 2447, below 2447 we confirm 2373. Everything should be slowly under weighted, except for the indexes, where we can accumulate tactical positions. For example, if $SPX 2719 is taken and $SPX holds above 2687.5 on pullbacks, we can tactically go for 2823. By concentrating our energies on $SPX/$IWM/$QQQ we will avoid the risk of being too spread out.
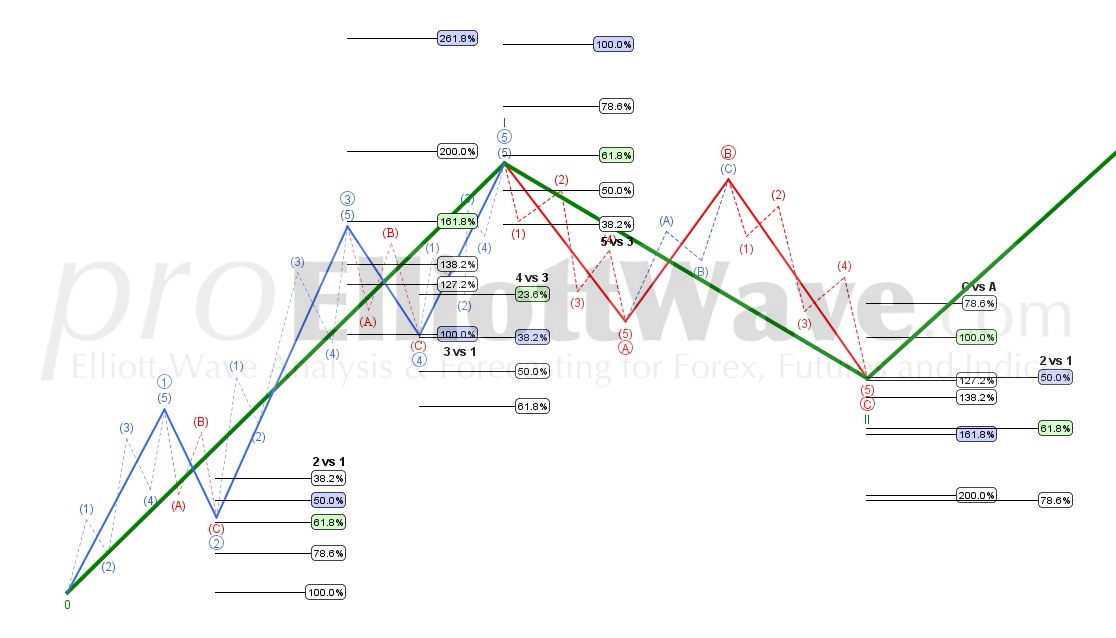
Rules
- Impulsive Waves always divide into 5 waves: Waves 1,2,3,4,& 5; followed by a corrective wave, typically A, B & C.
- The waves that are numbered (1,2,3,4,5) are in the direction of the Trend.
- The waves that are Lettered (A, B, C ) are against the Trend.
- Structure = 5-3-5-3-5 (21) followed by 5-3-5 (13)
- Wave 1 could divide into an impulsive 5 wave or a Leading Diagonal.
- Wave 3 is always an Impulsive 5 wave and is never the shortest wave.
- Waves 5 & C are always 5 waves but it could be an Ending Diagonal.
- Wave 2, 4 and B always subdivide in 3 wave corrections.
- Wave 2 Never moves beyond origin of Wave 1.
- Wave 3 must go beyond Wave 1.
- Wave 4 never moves into wave 1 range.
- Wave A can be a three wave structure or Leading Diagonal.
- Wave 5 often goes beyond Wave 3, if not it is called “Truncation”.
- The Chart shows a bull Market. For a Bear Market the chart can be flipped and all the rules remain the same.
- The same pattern can be viewed in all time frames: Thick Charts, 1 min, 2 min, 3 min, 5 min, 10 min, 15 min, 30 min, 1 h, 4h, Daily, Weekly, Monthly Charts etc…
Guidelines:
- Waves 2 & 4 will almost always Alternate into ZigZags, Flats, or Combos.
- Wave 4 can be Flats, Triangles or Combinations
- Wave 2 which is usually ZigZag or a ZigZag combination.
- Wave 4 Usually Terminates in the same area as the Previous Wave 4 of Wave 3.
- Typical Fib counts for Wave 2 is 50%, 61.8% of Wave 1.
- Typical Fib Count of Wave 4 is 38.2% or 61.8% of wave 3.
- See the charts for other Fibonacci relations.
- Often Waves ad-hear to the laws of Channeling:
- 5 ends around the Chanel line extension of endpoints of 1-3, and
- Wave 4 may end at the parallel line point 1-3. (please look at the charts)
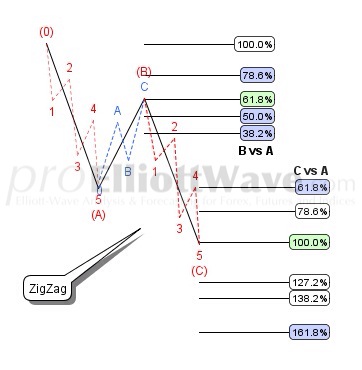
Rules
- ZigZag is always a 3 wave structure.
- Structure = 5-3-5
- Wave B never move beyond the start of Wave A.
- Wave B is subdivided into a three wave pattern: zigzag, flat, triangle or any combination thereof.
- Wave A can be either an Impulsive wave or a Leading Diagonal.
- Wave C can subdivide into 5 wave structures: a Diagonal or an Impulse wave.
Guidelines:
- Waves A and C connected is usually parallel to the Line connecting the origin of the ZigZag to point B.
- Waves A and C usually are Equal in length.
- Wave A and C are more often subdivided into an Impulse Wave.
- Wave C is always ended beyond Wave A.
- Besides Waves A & C usually being equal, the ratios in a correction are less accurate than in an Impulse Waves 1,3 & 5.
- See the chart for Typical Fibonacci Retracements.
Glossary
R within links stands for Running
F within links stands for Forced.
(()) double parenthesis stand for macro count from 2009 lows.
As shown on the Chart below that the most probable count for VT, the Vanguard Total World Stock Index ETF. We can see wave (2) was a running flat, beautiful in it’s nature, you don’t need to do anything; the flat plays and develops itself naturally, this is the reason I cordially invite you take it as natural.
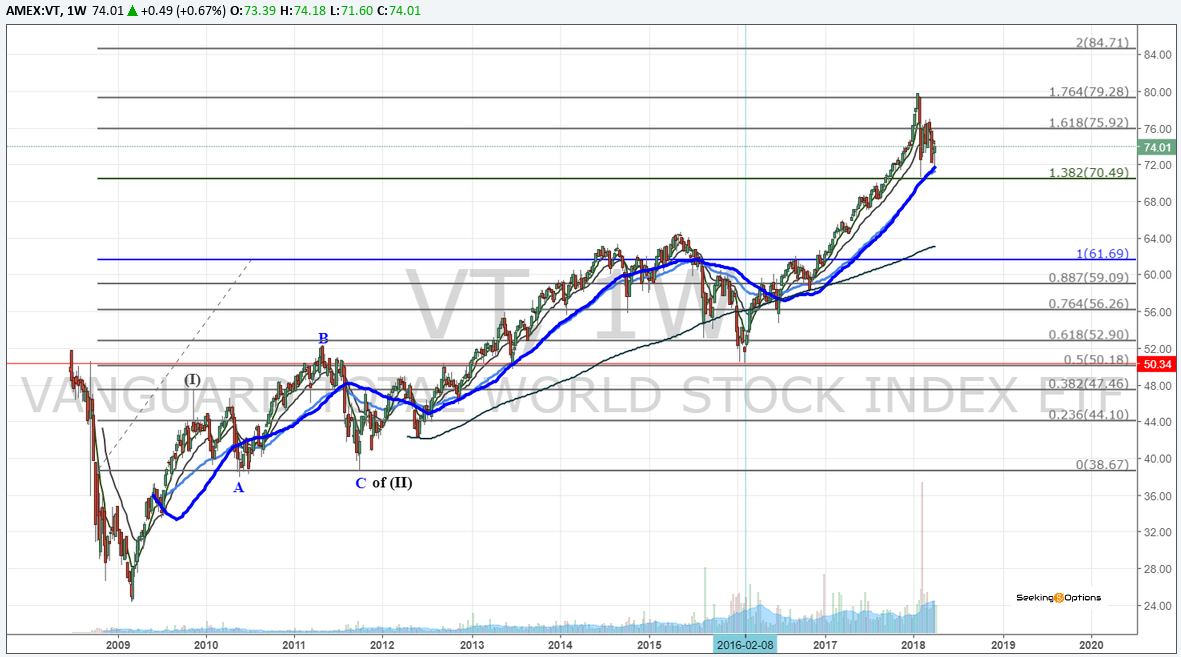
We prefer this count over other more tortured lucubration, if we say for example, that this is a 1-2-(1)-(2); we will have an overlap in any subdivision that we force versus the February 2016 decline, it is clear here on chart below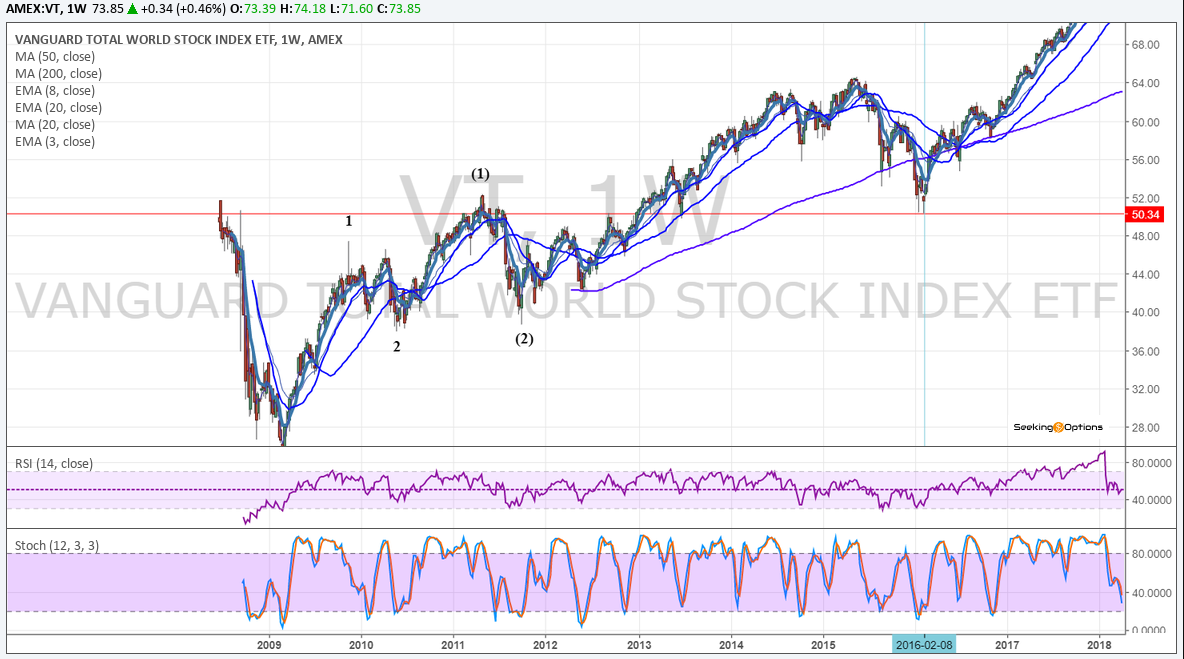
52.31 high of wave (1) versus 50.35 low of the 2016 decline, overlap is clear; now if we gracefully divide the counts as macro ((I))-((II))-((III)), definitely wave ((III)) off the 2009 lows has ran its course 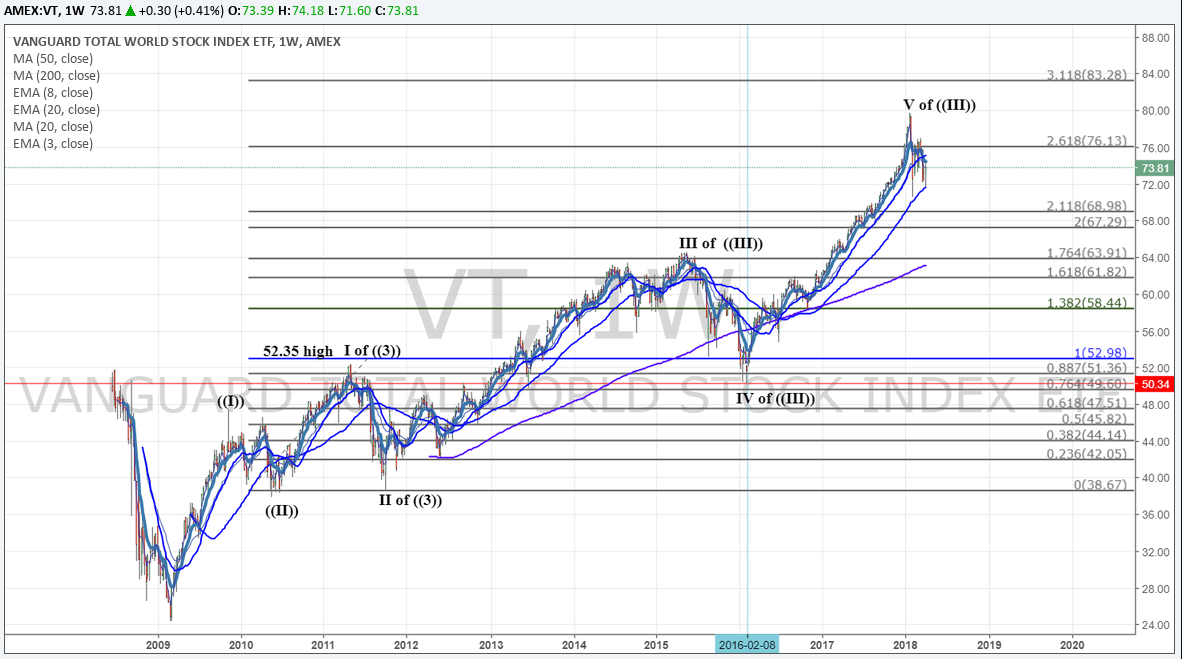 at the 2.618 for wave V of macro ((III)), we have an overlap within macro ((III)), so please pay close attention because what I am posting here is important, and if you don’t read carefully we will make a tremendous mistake.
So, here is the important question, based on this chart alone, what is the standard pullback? Well, standard 1% for this chart 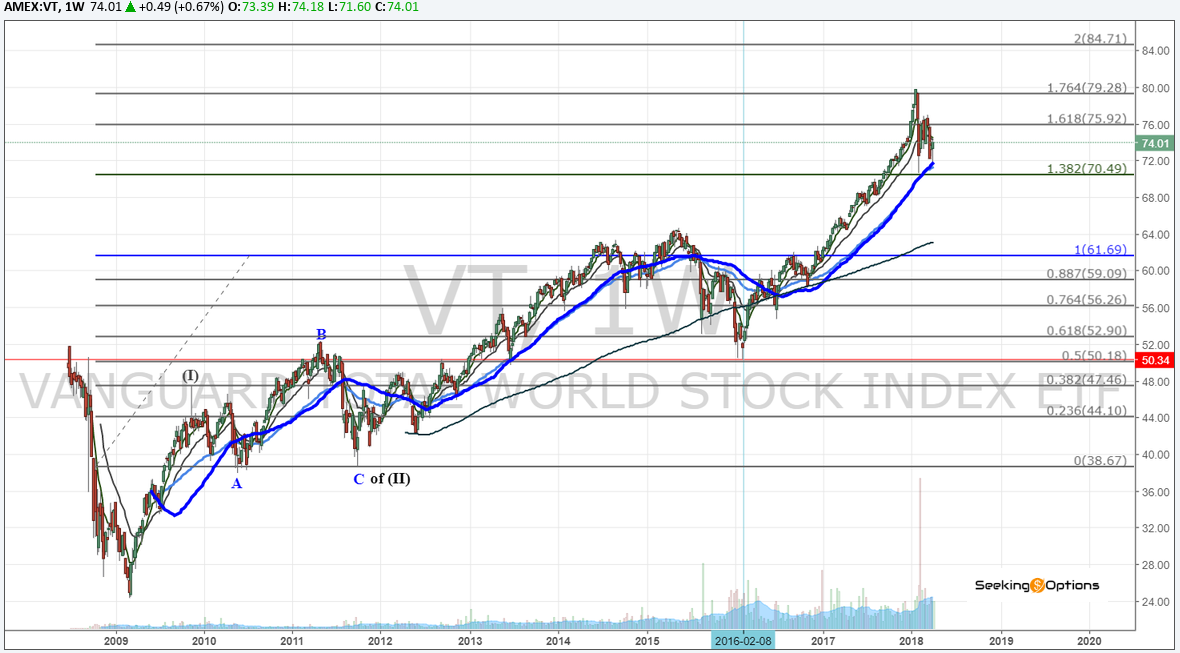 is 61.01 or a 17% correction from current levels. If this ETF tracks SPX perfectly, this would imply SPX should see the 2190 level. While the chart is beautiful, it’s implications are not. So first let me tell you what I think, I think primarily that bears are being honest and are playing it’s game fair, we, the bulls, are committing a mistake because our time is running out fast, our time to be aggressive on the long side is over gentlemen.
If some upside is left, it should be in the 5th of the V of macro ((III)), so we are playing the last squiggles of something that is ending, like miners that decide to work on a planet too close to a Supernova whose time is over, might explode anytime, we are playing a risky game… risk won’t bode well if we don’t play it with strict rules.


