On January 22nd we wrote :
I rather to take this structure on TSLA as an abc (link) with support at 339.12. I have always thought that TSLA has pending issues with the target at 518 and I still don’t understand why that target has not been met. This is the reason we have pressed TSLA on the long side on any decent setup; always looking for that pattern that takes it to that 518, which not necessarily needs to be a perfect 1-2.
So again this abc in red has support at 339.12, once it goes above 360 probabilities for higher will increase, but at the moment, at 356 they are not clear enough. Right now it is at this ROG that comes from August 2017 (link), stochastics is at 91.58 embedded, daily 262 is at 363 and weekly 162 is at 363 too, so based on this any breakout will depend on TSLA’s ability to take and hold above 363 zone.
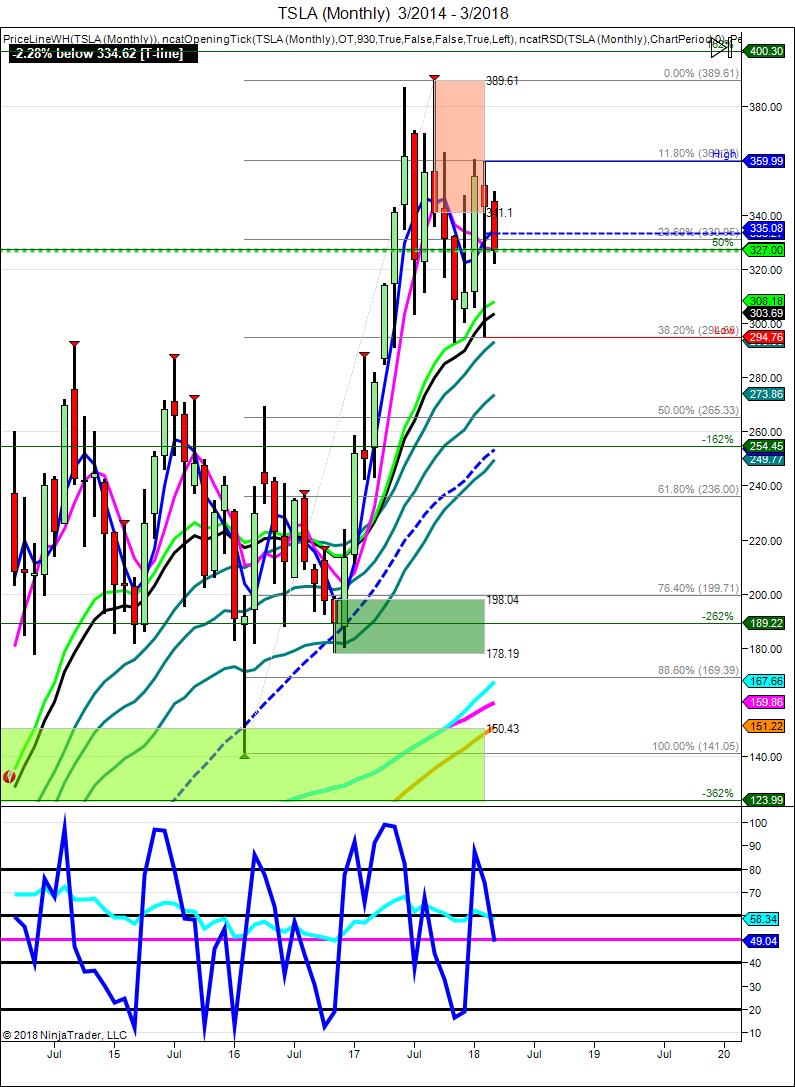
Monthly 162 is at 376, and 262 monthly is at 424, so based on the big picture versus the squiggles let’s see if our support at 340 area holds or if TSLA has the capacity to take and hold above 363.
So, by reading previous paragraphs sent on January 22nd we can note that we have maintained a long term bullish approach on TSLA considering the long term charts; but we are sending this update because we are unusually concerned about one of our leaders. Sometimes our leaders can have a bad quarter or two, but our leaders usually come back in strong manner, erasing losses quickly after they have properly adapted to changing circumstances, but today I read some financial officers are/might be leaving TSLA and that certainly got me concerned, so we will revise all our macro supports.
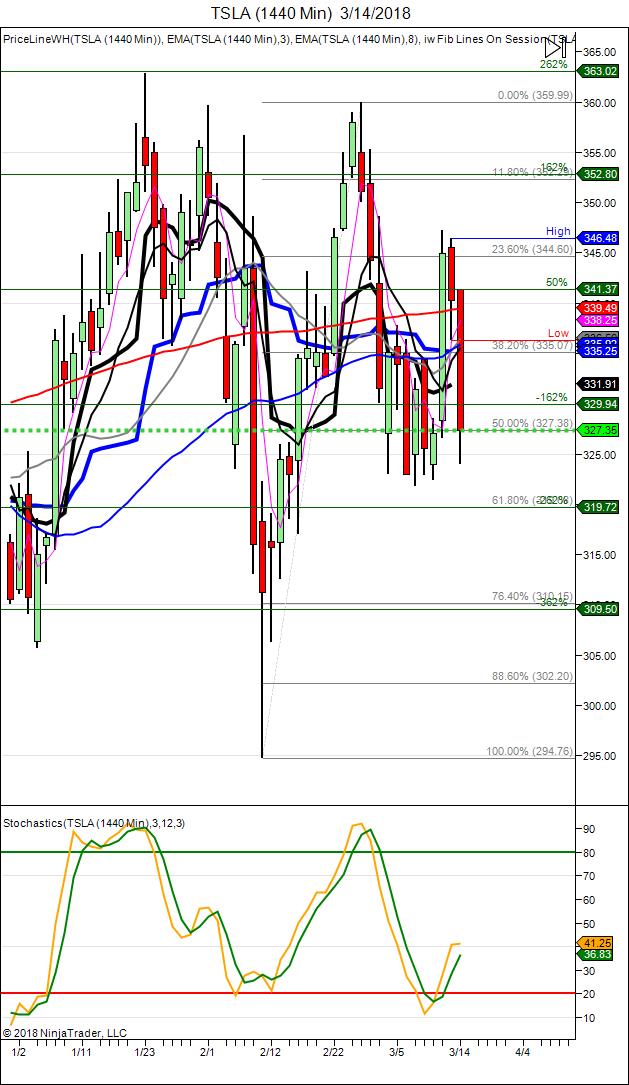
First looking at (link1) we see there is a potential return of 60% on TSLA with ideal targets at 481and 560, based alone on the total structure of the price. Following is (link2) where there are enough hits to the 1% extension as to consider that any wave iv of any has been fulfilled; this count on link 2 at a minimum projects 450.
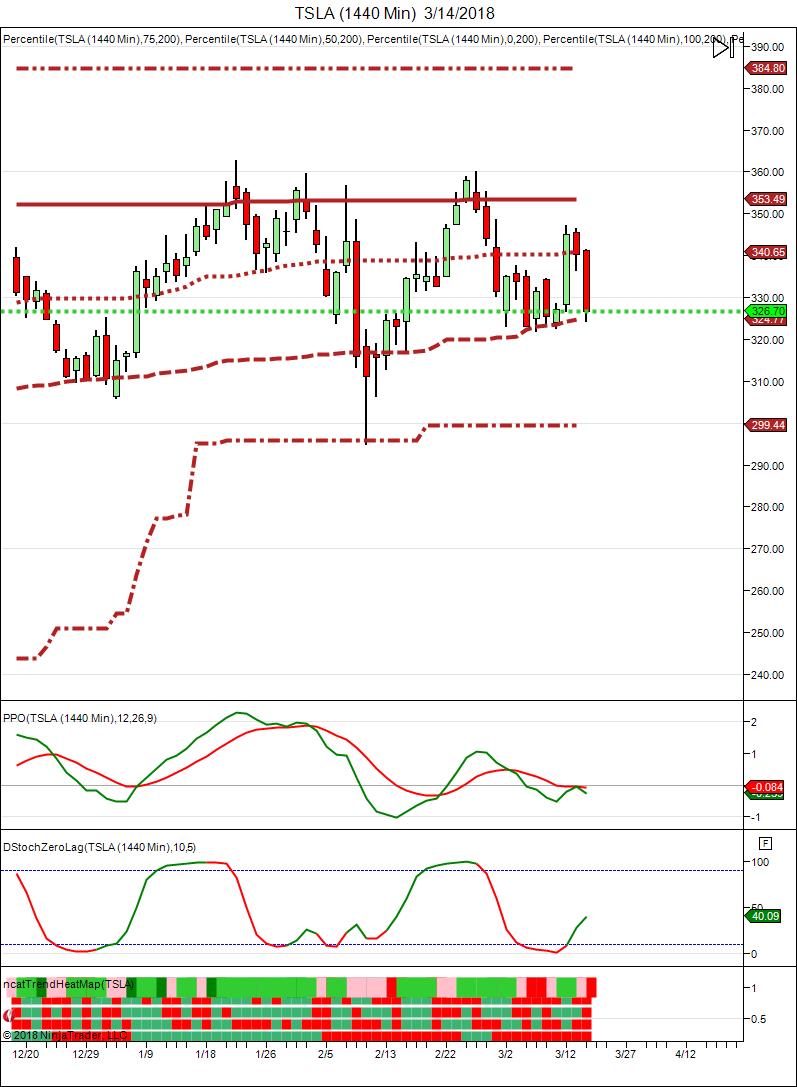
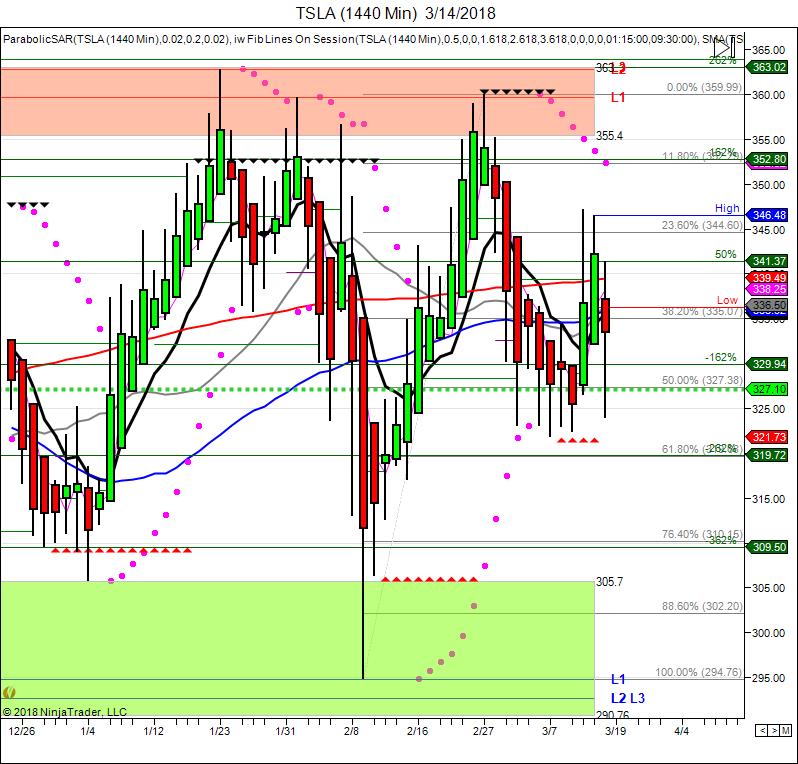
Initially we will hold onto our last bull count on this (link3) before considering a reduction in our exposure; here wave 0/1/2 was a type of diagonal and now is working on the subdivision i/ii with support and ideal target at 309.79. Invalidation for this last bullish approach is 294.76, so while 309.79 can be spiked on the downside, our 294.76 should not be broken. By breaking 294.76 immediate target for TSLA should be no other than 266 (link) with Joel’s -162 monthly at 254. Average for these two approaches is 260; that level is certainly the most important spot for TSLA, holding this line our long term counts for 518/568 are still healthy and in good shape.
As to how to trade these probabilities while long shares: Once TSLA breaks 324.08 again tomorrow during regular hours traders should add 310 puts strikes and hold onto them while 344.50 is not taken, if further downside under 310 is seen and only if 294.76 is taken, traders should be more confident about this protection considering that ideally 260 should be seen.
Reducing positions in a 50-30% is good too, waiting for opportunities to reload at 260 area.
We are still long bias and like the stock for higher prices, but ones must trade accordingly..
Seeking Options Team
Join for Trade Updates (SWING and MOMO Trades]


